Figure 7.
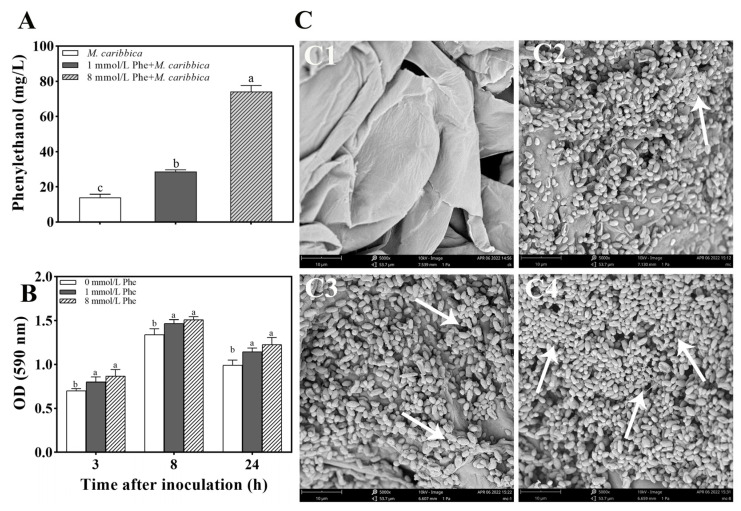
Effect of Phe on phenylethanol production and biofilm formation of M. caribbica. (A) Influence of different Phe concentrations on the phenylethanol content produced by M. caribbica. The vertical bar denotes the standard deviation of the mean. (B) Influence of different Phe concentrations on biofilm formation of M. caribbica. (C) SEM of jujube wound tissues 48 h after inoculation. Wounds were incubated with (C1) SDW, (C2) M. caribbica, (C3) M. caribbica obtained from NYDB medium with 1 mmol/L Phe, and (C4) M. caribbica obtained from NYDB medium with 8 mmol/L Phe. (C1–C4): magnification of 5000×. White arrows indicate the extracellular matrix secreted by M.caribbica. Error bars indicate the standard deviation, and different letters indicate significant differences (p < 0.05).

