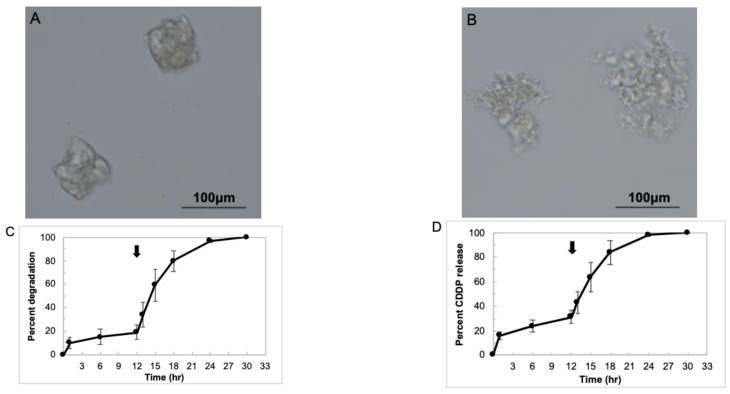
Figure 2.
Characterization of CDDP-crosslinked gelatin hydrogels (CCGH). (A) A microscopic image of dried CCGH. Scale bar: 100 μm. (B) A microscopic image of CCGH dispersed in DDW. Scale bar: 100 μm. (C) Degradation profiles of CCGH. Collagenase D was added at the time indicated by the arrow (12 h). (n = 6). Data were represented as mean ± SD. (D) CDDP release profiles from CCGH. Collagenase D was added at the time indicated by the arrow (12 h). (n = 6). Data were represented as mean ± SD.

