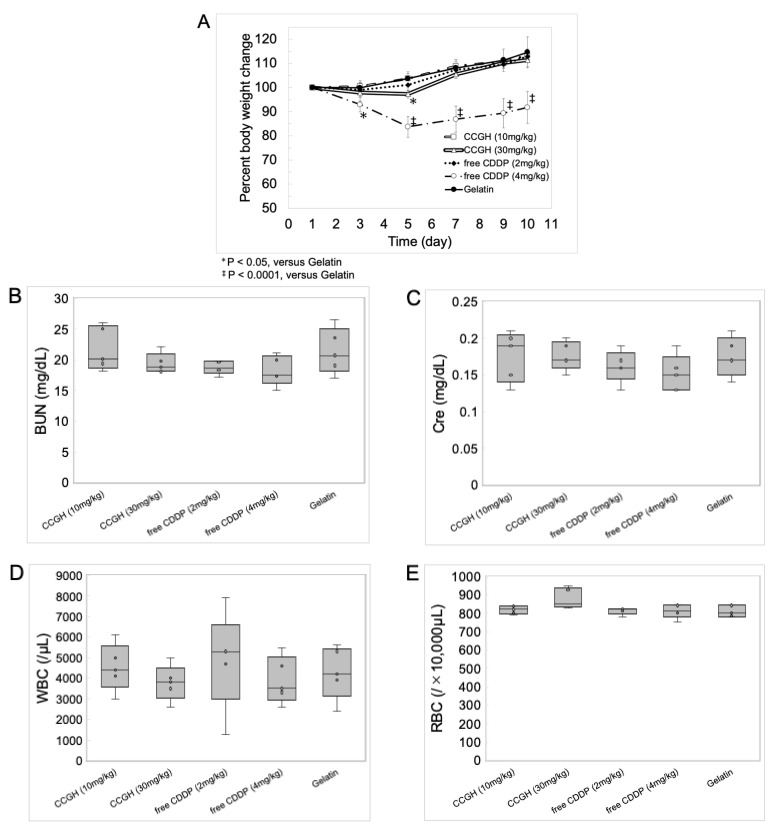
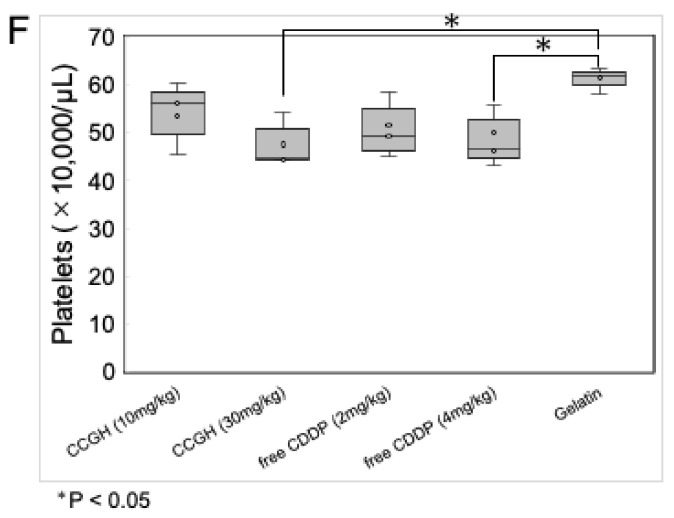
Figure 6.
In vivo toxicity evaluation after treatment (day 1) in mice. (A) The profiles of body weight change. CCGH (10 mg/kg; double dot-dash line), CCGH (30 mg/kg; double line), free CDDP solution (2 mg/kg; dotted line), free CDDP solution (4 mg/kg; dot-dash line), and gelatin solution (thin solid line). (n = 5). Data were represented as mean ± SD. (B–F) Hematological examination data on day 10. (B) Serum concentrations of blood urea nitrogen (BUN). (C) Serum concentrations of creatinine (Cre). (D) Numbers of white blood cells (WBCs). (E) Numbers of red blood cells (RBCs). (F) Numbers of platelets. CCGH (10 mg/kg), CCGH (30 mg/kg), free CDDP solution (2 mg/kg), free CDDP solution (4 mg/kg), and gelatin solution. (n = 5).


