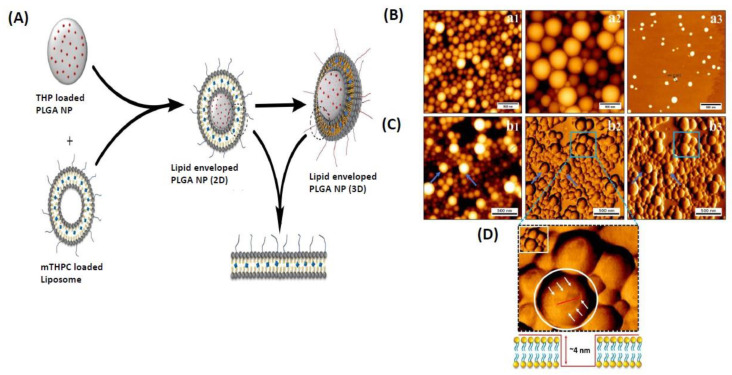
Figure 4.
Biodegradable nanoparticles with lipid bilayers are shown schematically in (A). Morphology of the surface depicted in (B–D). (A) AFM imaging of THP-NP 200 nm, THP-NP 400 nm, and mTHPC-LP. AFM micrographs of lipid-coated nanoparticles are shown in panel (B). (a1) THP NP 200 nm; (a2) THP NP 400 nm and (a3) mTHPC-LP using AFM. Lock-in amplitude view, lock-in phase view, and height measured view. Lipoparticle thickness around PLGA nanoparticles is seen in (C) using an AFM cross-sectional profile. (b1) height measured view; (b2) lock-in amplitude view and (b3) lock-in phase view. The bar’s width corresponds to 500 nm. The figure is adapted from [71] with copyright permission.

