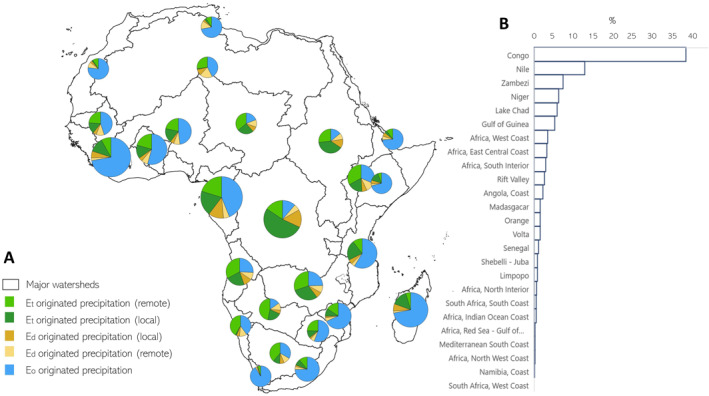
Figure 1.

Sources of mean annual P over major African watersheds averaged over 1981–2016. (a) Shades of green represent vegetation‐sourced P over the watershed; shades of yellow represent precipitation originated from E d . Blue represents the ocean‐originated precipitation. The size of each pie‐chart represents the magnitude of mean annual precipitation. (b) Contribution (%) of each watershed to the total continental E t ‐sourced precipitation. Figure S1 in Supporting Information S1 shows the corresponding names of the watersheds.
