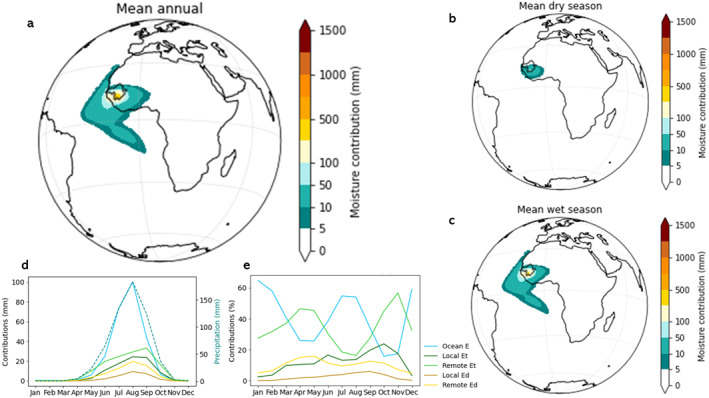
Figure 5.

(a) Mean moisture source regions for the Senegal basin (black delineation). All moisture source regions <5 mm are considered insignificant contributors and are not visible on this map (in white); (b) Mean moisture source regions during the dry season; (c) Mean moisture source regions during the wet season; (d) Intra‐annual absolute contributions of different moisture sources (mm, left axis) and P (mm, right axis, dashed line); (e) Intra‐annual relative contributions of different moisture sources (%); all averaged over the full climatology.
