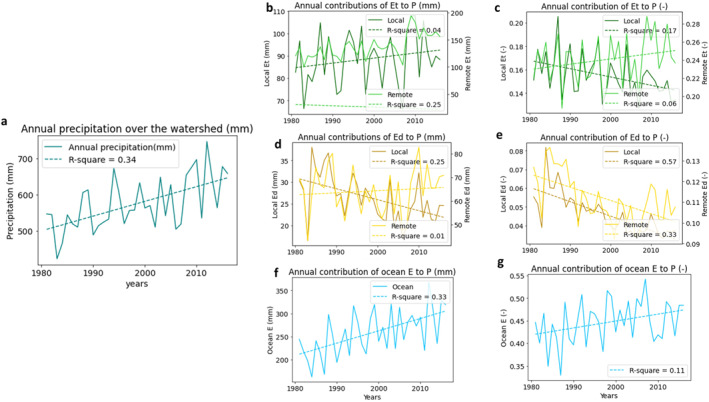
Figure 6.

(a) Annual P (mm) over the Senegal basin between 1981 and 2016; (b and c) Annual contribution of E t to P in mm and fractional contribution to total rainfall, respectively. Full line represents local sources, dashed line represents remote sources; (d and e) Annual contribution of E d in mm and fractional contribution to total rainfall, respectively. Full line represents local sources, dashed line represents remote sources. (f and g) Annual contribution of ocean E to P in mm and fractional contribution to total rainfall, respectively. Note the different scaling of the x‐axes corresponding to local (left y‐axis) and remote (right y‐axis) sources of E t and E d contributions.
