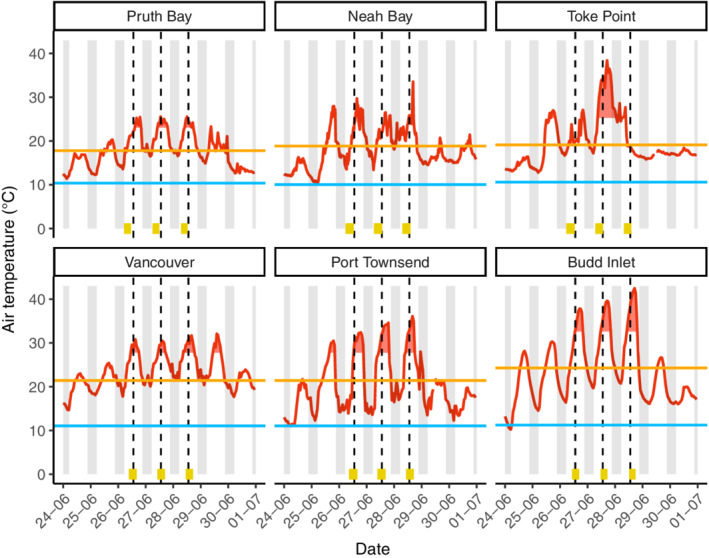
FIGURE 3.

Air temperatures (red line) at outer (top row: Pruth Bay, Neah Bay, Toke Point) and inner coast sites (bottom row: Vancouver, Port Townsend, Budd Inlet) measured over the course of the heatwave (26–28 June 2021) and surrounding days plotted with the 1991–2020 mean summer (June–August) high (orange) and low (blue) temperatures. Red shaded regions are temperatures greater than two standard deviations above the 1991–2020 mean. Gray shaded regions are night. Vertical dashed lines are solar noon during the heatwave. Gold bars at bottom of plots represent duration of intertidal exposure to air below +1 m tide elevation relative to mean lower low water (MLLW). Temperature and tide data were obtained from multiple sources (Appendix S1).
