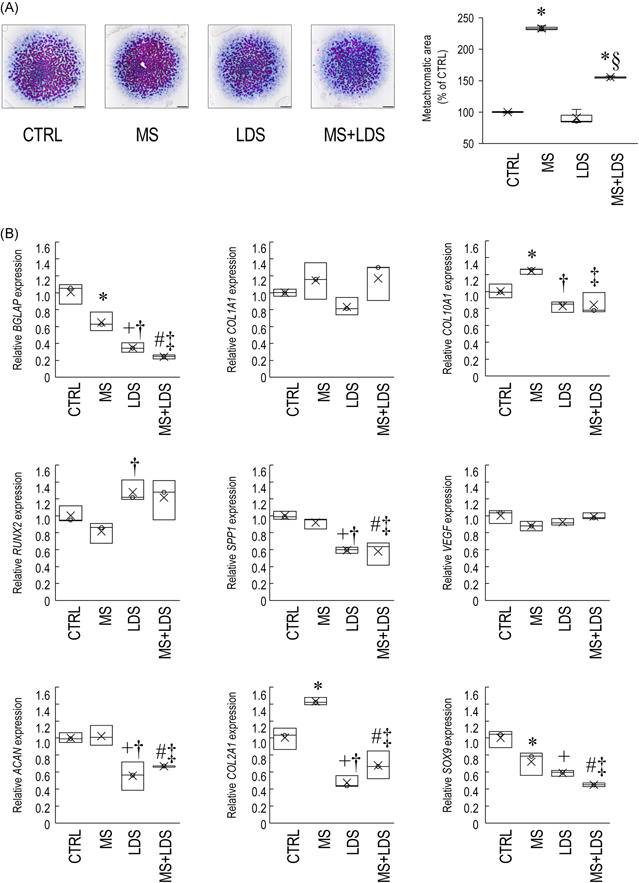
Figure 2.

Mechanical load administered to micromass cultures for 60 min on Days 1 through 6 increased chondrogenesis and metachromatic cartilage ECM production by Day 6 in a circadian clock‐dependent mechanism. (A) Metachromatic cartilage ECM accumulation during chondrogenesis in control versus mechanical load‐induced cultures, with or without LDS treatment, as determined by DMMB (qualitative) staining assay. Original magnification was 2×. Scale bar, 1 mm. The bar chart shows the results of MATLAB‐based image analysis of metachromatic areas in mechanically loaded versus control cultures, with or without LDS treatment. Data are expressed as mean ± SEM. Statistical significance (p < .05) is between mechanically stimulated and control cultures is indicated by asterisks (*), and between LDS‐treated and untreated samples by a section sign (§). Representative data are shown out of three independent experiments. (B) Cartilage‐specific, osteogenic, and chondrocyte hypertrophy marker gene expression on Day 6 following the mechanical loading scheme, with or without treatment with the circadian clock regulator LDS. Data are expressed as the mean ± SD relative to the control and normalised against the reference gene RPL13. Statistical significance (p < .05) between gene expression levels among different groups is indicated as follows: asterisk (*) denotes significant change between MS and control; plus sign (+) denotes significant change between LDS and control; hash sign (#) denotes significant change between combined treatment (MS + LDS) and untreated cultures; dagger (†) sign denotes significant change between MS versus LDS; and double dagger (‡) sign denotes significant change between MS versus MS + LDS. Detailed statistical comparison is given in Supporting Information: Table S2. CTRL, control; DMMB, dimethyl‐methylene blue; ECM, extracellular matrix; MS, mechanical stimuli; LDS, longdaysin.
