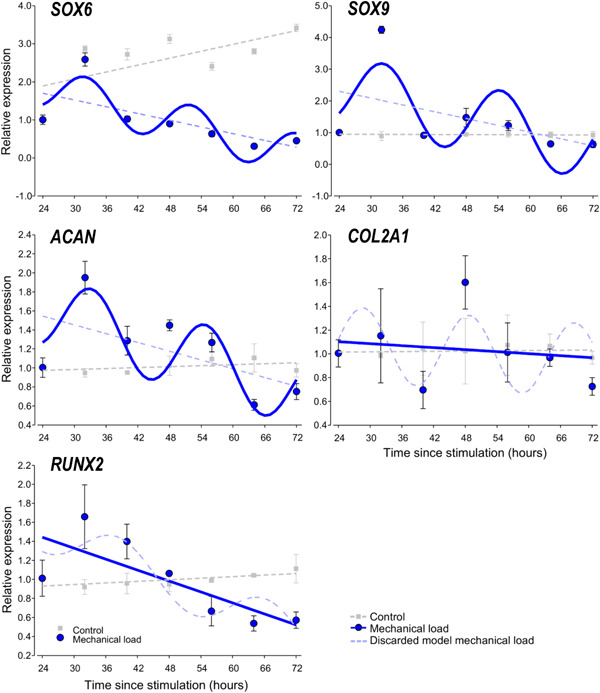
Figure 5.

Circadian rhythm dynamics in clock gene expression in 6‐day‐old differentiating embryonic limb bud‐derived chondroprogenitor cells of micromass cultures following synchronisation with uniaxial cyclic mechanical load. Quantitative RT‐PCR analyses followed by cosine fits showing temporal expression profiles of chondrogenic marker genes collected every 8 h between 24 and 72 h postsynchronisation with mechanical load (solid blue line or curve) versus nonstimulated control cultures (broken grey line) collected at the same time points. Each plot also includes the discarded model (i.e., a broken straight blue line if the cosine fit was significant, or a broken blue sinusoidal curve if the cosine fit was not significant). Data are expressed as the mean of transcript levels ± SD relative to the 24‐h time point and normalised against the reference gene RPL13. Representative data are shown out of three independent experiments, each exhibiting similar patterns of gene expression profiles. RT‐qPCR, quantitative real‐time polymerase chain reaction.
