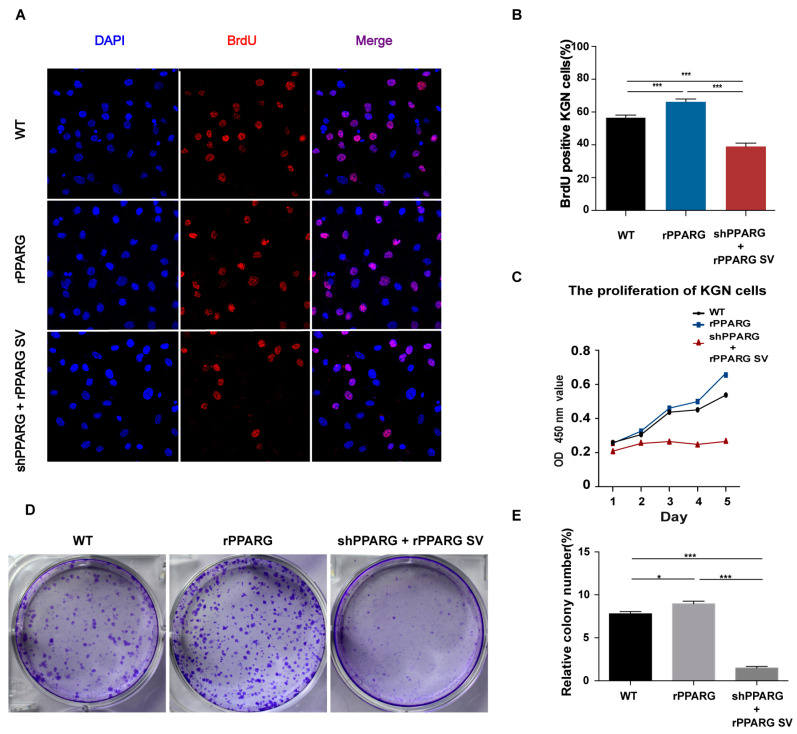
Figure 2.
Measurements of cell proliferation in KGN cells. (A,B) BrdU staining was performed to measure KGN cells, and the BrdU-positive cells were calculated. Scale bar: 100 μm. (C) A CCK-8 assay showed that PPARG downregulation and overexpression of its SV significantly impeded the proliferation of KGN cell lines. (D,E) Colony formation assays showed significant differences among the three cell groups. The data are presented as the mean ± SD. * p < 0.05, *** p < 0.001.

