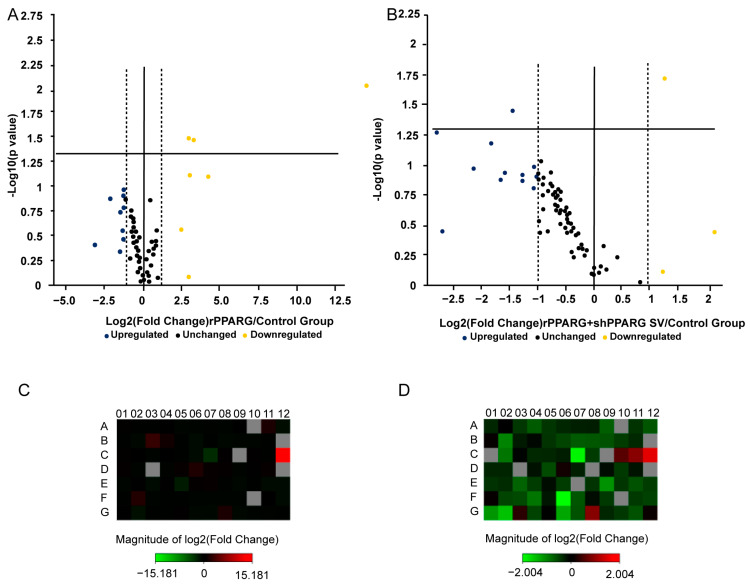
Figure 6.
Results of PCR array. (A) Genes upregulated and downregulated in the rPPARG group vs. the control group (WT) (scatter plot). (B) Genes upregulated and downregulated in the shPPARG +rPPARG SV group vs. the control group (WT) (scatter plot). (C) PCR array heatmap of the rPPARG group vs. the control group (WT). (D) PCR array heatmap of the shPPARG +rPPARG SV group vs. the control group (WT).

