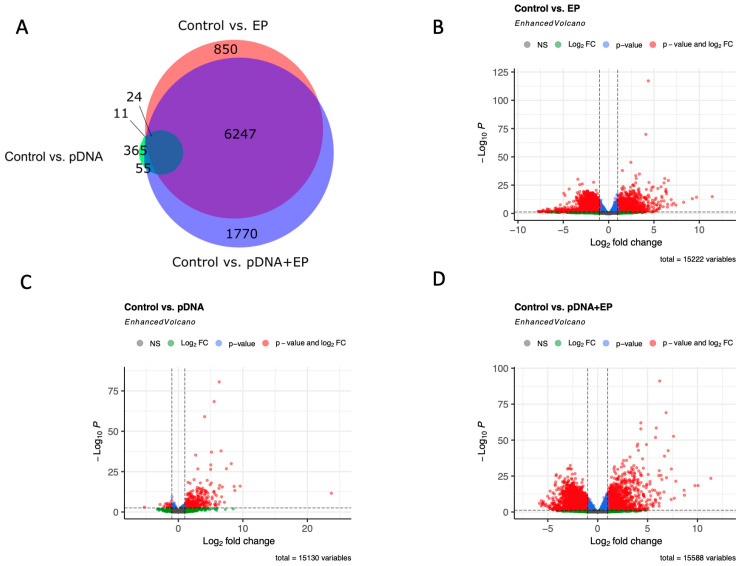
Figure 1.
Differential expression analysis between groups. Differentially expressed genes with adjusted p-values < 0.001 and an absolute log2 fold changes > 2 were considered significant. (A) Venn diagram shows the distribution of differentially expressed among pairwise comparisons. Volcano plots show significant gene expression changes between control skeletal muscle and (B) pulsed muscle, (C) muscle receiving plasmid injection only, and (D) muscle receiving plasmid electroporation.

