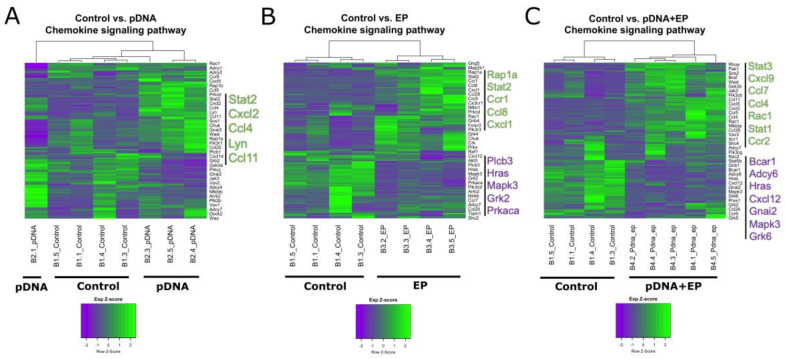
Figure 2.
Heatmap gene cluster grouping for control and experimental groups for the chemokine signaling pathway. (A) pDNA, gWiz-blank injection, (B) EP, electroporation, and (C) pDNA + EP, gWiz-blank injection followed by electroporation. The dendrograms depicting hierarchical clustering are based on the expression of genes in the given set. The columns are samples and the rows are genes. Green represents above average expression while purple represents below average expression. Specific up-regulated and down-regulated genes are emphasized in green or purple font, respectively. n = 4–5 per group.

