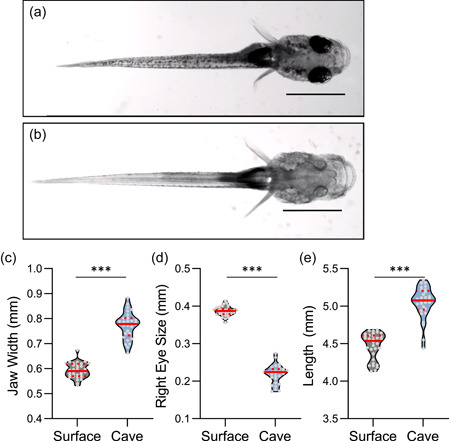
Figure 1.

Morphological differences between purebred surface and Pachón cavefish populations. (a and b) Dorsal image of surface (a) and Pachón cavefish (Bb). Scale bars denote 1 mm. (c) Jaw width is significantly greater in cavefish compared to surface fish (t‐test: t 59 = 16.48, p < .0001). (d) Eye size is significantly greater in surface fish (t‐test: t 59 = 33.80, p < .0001). (e) Length is significantly greater in cavefish compared to surface fish (t‐test: t 59 = 11.55, p < .0001). For each trait, the median (center line) as well as 25th and 75th percentiles (top and bottom lines) are shown. Circles represent values from individual fish. ***denotes p < .001. [Color figure can be viewed at wileyonlinelibrary.com]
