Figure 2.

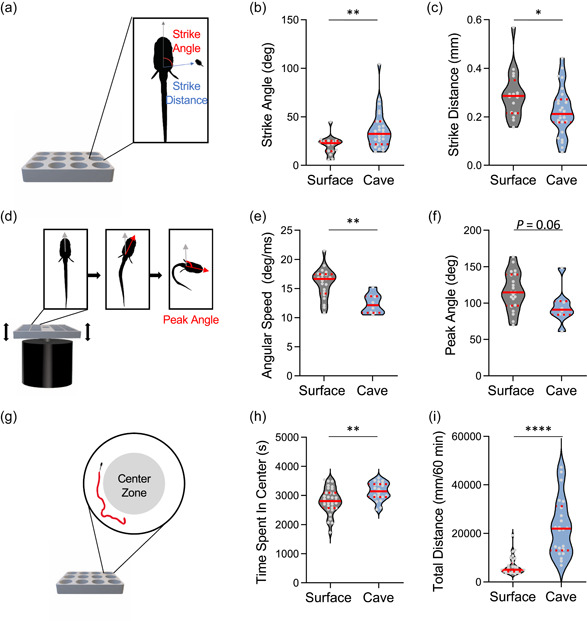
Behavioral variation in surface and cavefish (a) Diagram of prey capture apparatus. Videos were used to extract strike angle (red) and strike distance (blue) between Artemia and the head of the fish. (b) Strike angle is significantly greater in cavefish than surface fish (t‐test: t 41 = 3.006, p < .0045). (c) Strike distance in surface fish is significantly greater than in cavefish (t‐test: t 41 = 2.209, p < .0328). (a) Image of startle reflex set up. Plate sits on a mini‐shaker (black) to induce a startle. Videos were used to extract angular speed and peak angle (red). Grey arrow denotes head orientation at the initiation of the startle stimulus. (e) Angular speed in surface fish is significantly greater than in cavefish (t‐test: t 27 = 3.629, p < .0012). (f) Peak angle in surface fish is greater, approaching significance, than cavefish (t‐test: t 27 = 1.928, p < .0645). (g) Image of locomotor assay where fish were recorded in individual wells for 1‐h and to analyze total locomotor activity and time in the center of the well (grey area). (h) Time spent in the center in surface fish is significantly greater than cavefish (t‐test: t37 = 4.710, p < .0013) (i) Total distance in surface fish is significantly less than in cavefish. (t‐test: t 37 = 6.506, p < .0001). For each trait, the median (center line) as well as 25th and 75th percentiles (dotted lines) are shown. Circles represent values from individual fish. *denotes p < .05, **denotes p < .01; ***denotes p < .001. [Color figure can be viewed at wileyonlinelibrary.com]
