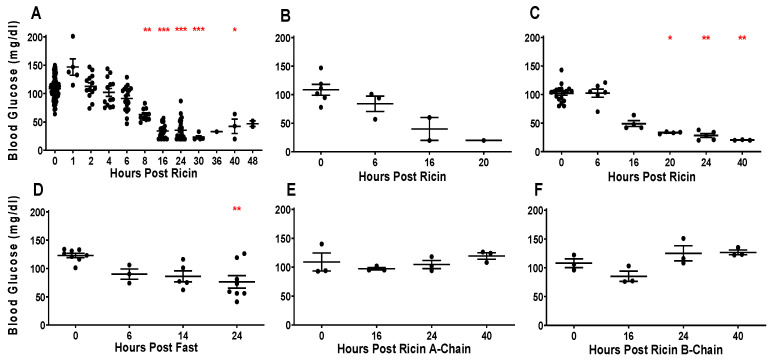
Figure 1.
Hypoglycemic response to parenteral injection of ricin. Blood glucose of mice at different time points, each dot represents an individual mouse. Blood glucose is shown on the vertical axis and time post injection is on the horizontal axis. Swiss mice were used, except where noted. The mean and standard error for each time point are shown. The Kruskal–Wallis test was performed and the red asterisks above the groups show the results of Dunn’s multiple comparison test vs. the control group: 0.05 (*), 0.002 (**), and <0.001 (***). (A) Ip injection of 30 µg/kg of ricin into mice. The mice shown here were used in the experiments described in the remaining figures. (B) Iv injection of the same dose of ricin. (C) Ip injection of ricin into NSG mice. (D) No ricin injection or food given. (E) Ip injection of 60 µg/kg ricin A-chain. (F) Ip injection of 60 µg/kg ricin B-chain.

