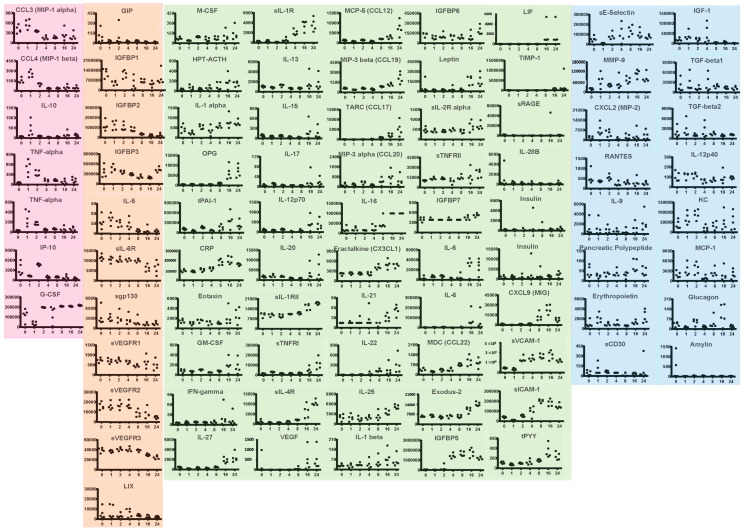
Figure 3.
Multiplex analysis of plasma response to ricin injection. Groups of five mice were injected ip with 30 µg/kg of ricin. Each dot represents an individual mouse. Samples were obtained prior to and at 1, 2, 4, 8, 16 and 24 h post ricin. Results of multiplex analyses, testing for the cytokines and hormones, are shown above. Time course profiles are grouped based on kinetics of changes. Pink indicates changes within 1–2 h. Orange indicates decrease over time. Green indicates increases over time. Blue has no discernable pattern.

