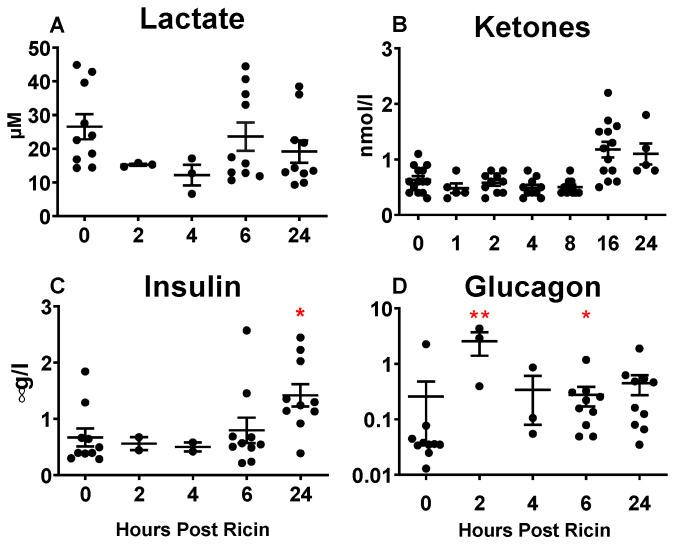
Figure 4.
Systemic metabolic and hormonal response in plasma to ricin injection. Metabolite or hormone levels were measured in plasma at different time points. Each dot represents an individual mouse. The Kruskal–Wallis test was performed and the red asterisks above the groups show the results of Dunn’s multiple comparison test vs. the control group: 0.05 (*) and 0.002 (**). (A) Lactate. (B) Ketones. (C) Insulin. (D) Glucagon.

