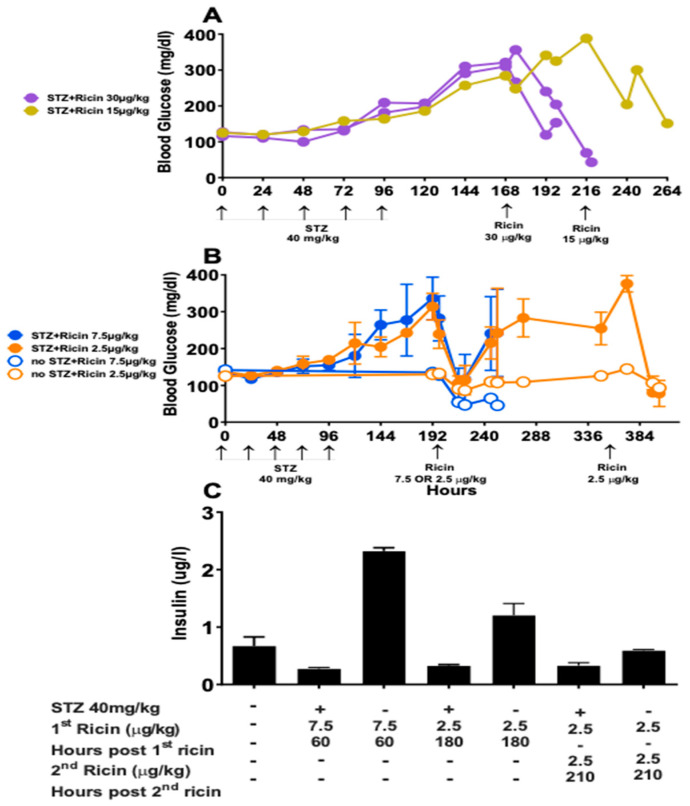
Figure 7.
Blood glucose and insulin following STZ-induced diabetes and ricin injection. Mice received 5 daily doses of STZ at 40 mg/kg to chemically induce diabetes. Blood glucose was measured daily prior to ricin injection. Post ricin, measurements were taken at 10 a.m. and 4 p.m. daily. (A). Each curve represents the blood glucose vs. time of an individual mouse. Two mice were injected with ricin at 30 µg/kg at hour 168, 72 h post last STZ injection. The third mouse was injected with 15 µg/kg of ricin 120 h post STZ. (B). The mean and SEM of blood glucose vs. time of groups of three mice are shown. Two treatment groups received STZ and two did not. At hour 192, 96 h post STZ, ricin was injected at 7.5 µg/kg or 2.5 µg/kg. At 276 h post STZ, the groups that received 2.5 µg/kg of ricin received another equivalent dose. (C). Plasma insulin was measured in the same mice as in (B), mean and SEM are shown.

