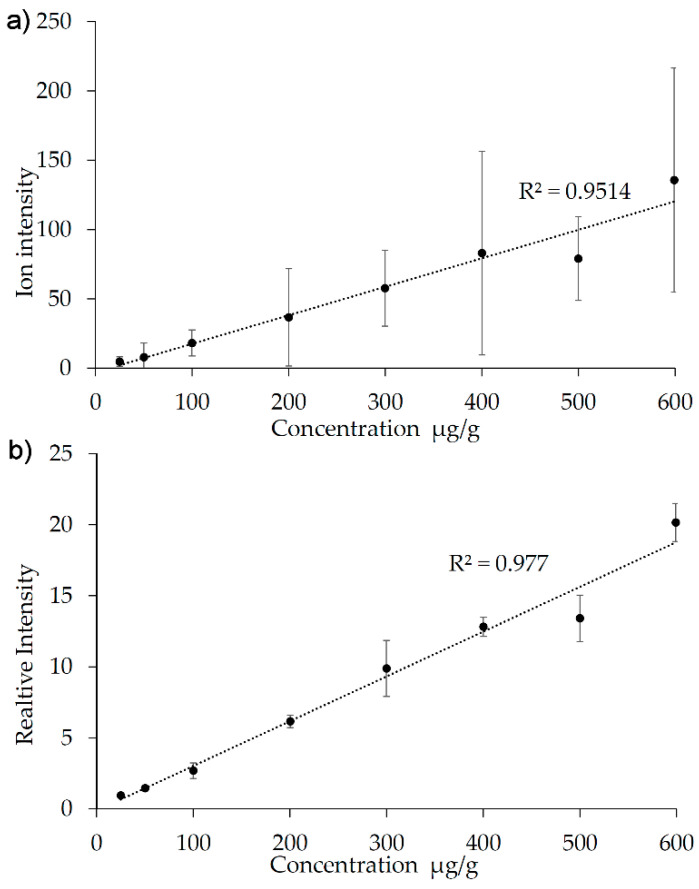
Figure 5.
Calibration curve based on a mimetic tissue model in porcine skin with and without normalization to the internal standard. (a) Without normalization. (b) With normalization to the reserpine signal at m/z 609.2804. The error bars show the standard variation calculated from measurements on neighboring sections of the calibration block on three consecutive days.

