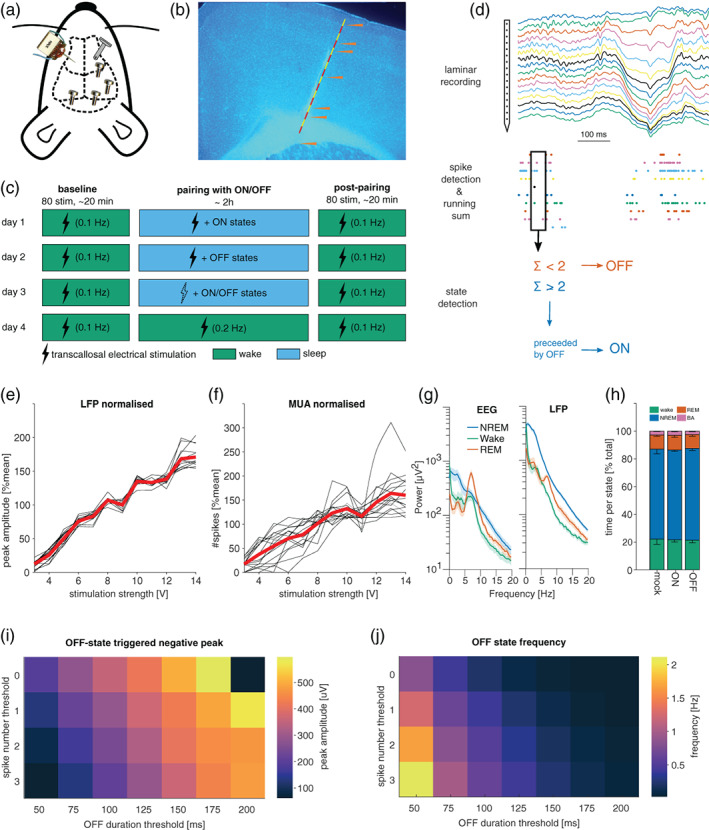
FIGURE 1.

Methodological approach. (a) Schematic of cranial electrode placement: 16‐channel laminar probe (left) was inserted into M1 contralateral to the stimulation electrode (right), in addition to electroencephalogram (EEG) electrodes in the frontal and the occipital derivation. (b) Representative histology image. (c) Experimental design. Each mouse was subjected to four stimulation paradigms, each on a separate experimental day. Each stimulation paradigm includes a baseline and post‐pairing stimulation period with 80 stimulations at 0.1 Hz during wakefulness. (d) The method used for ON and OFF periods detection. (e) Example of dose–response curves in the local field potential (LFP) in response to stimulation in one animal. Black lines show the average response across trials of a single channel in the laminar probe. The red line is the average across all channels. (f) Same as (e), but for spiking. (g) Example of power spectral density in the EEG (left) and LFP (right) during different vigilance states. (h) Time spent per vigilance state (± SEM) across all mice in the different experimental conditions. (i,j) Simulations illustrating the effects of varying parameters of the real‐time ON/OFF‐state detection algorithm. Longer and stricter (i.e. fewer spikes) neuronal silent periods result in a larger peak in the LFP (i), which occur progressively more rarely (j). Note the resulting trade‐off between parameters resulting in a large LFP peak and parameters resulting in frequent detection events
