FIGURE 4.

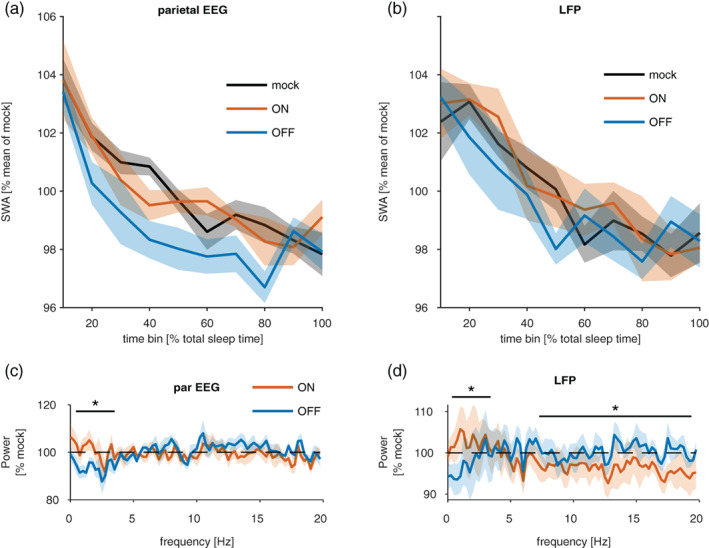
Effects of closed‐loop stimulation on sleep electroencephalogram (EEG). (a,b) The time course of EEG slow‐wave activity (SWA; 0.5–4 Hz) during non‐rapid eye movement (NREM) sleep across the stimulation session in the parietal EEG signal and the local field potential (LFP) recorded from M1 area. Relative values of SWA are plotted in 10‐min bins separately for mock stimulation, ON and OFF pairing conditions. Mean values ± SEM, n = 7 mice. (c,d) The effects of stimulation on EEG and LFP power spectra during NREM sleep. Spectral power values in ON and OFF pairing conditions are expressed as percentage of corresponding frequency bins during the mock stimulation condition for the parietal EEG and LFP signals. Asterisks above denote frequency bands where the effects of ON and OFF pairing differed significantly (p < 0.05)
