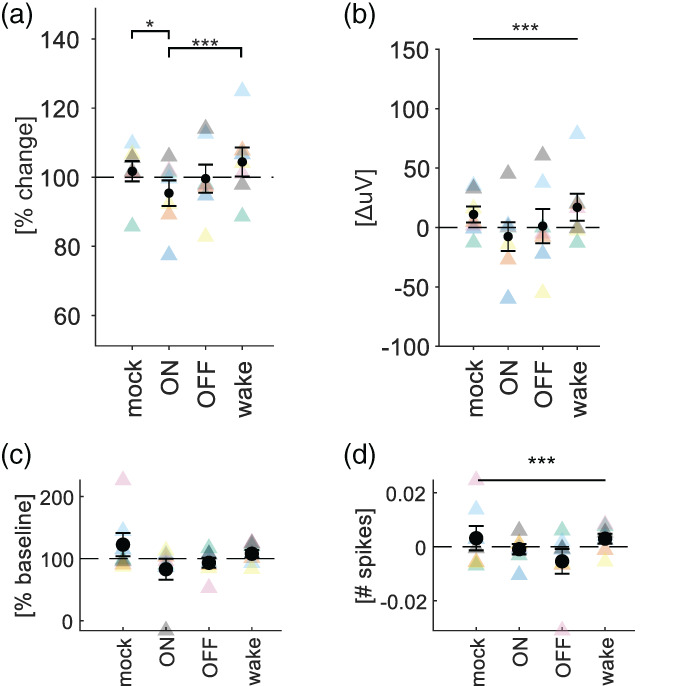
FIGURE 5.

Effects of stimulation targeting ON and OFF periods during sleep on MUA and local field potential (LFP) responses during waking. (a) Changes in average LFP amplitude triggered by stimulation during wakefulness before and after pairing stimulation with ON‐ or OFF‐states. Peak responses were normalised by their baseline amplitude. Black circles show mean ± SEM, and coloured triangles show individual mice. Bars represent pairwise comparisons. *p < 0.05, **p < 0.01, ***p < 0.001. (b) Same as in (a) but without normalisation to baseline. Bars spanning all conditions indicate significant main effect of condition. ***p < 0.001. (c,d) Same as in (a) and (b), but for MUA
