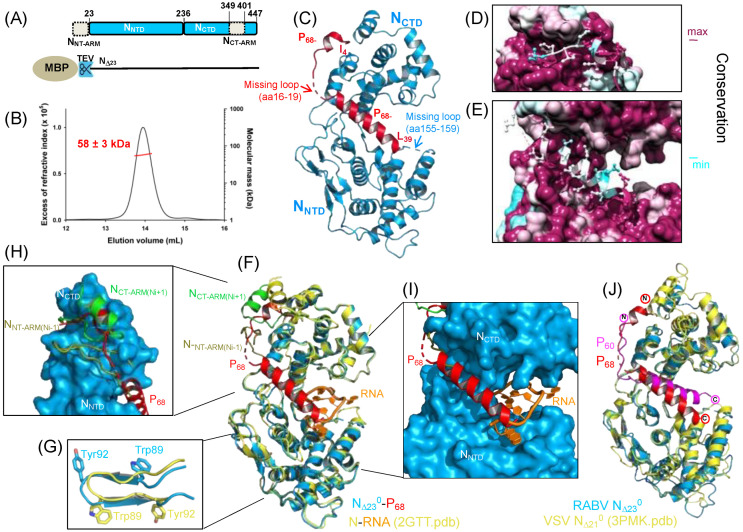
Figure 2.
Crystal structure of RABV N∆230−P68 core complex. (A) Schematic representation of RABV nucleoprotein modular organization and construct. The upper part shows the structural organization of the nucleoprotein. Boxes indicate the localization of folded domains, dotted boxes the localization of the exchanging subdomains NNT-ARM and NCT-ARM. The lower part shows the construct of the nucleoprotein used in this study. (B) SEC MALLS of the reconstituted complex. The elution was monitored on-line using multi-angle laser light scattering and differential refractometry. The line shows the chromatograms monitored by differential refractive index measurements. The red crosses indicate the molecular mass across the elution peak calculated from static light scattering and the numbers indicate the weight-averaged molecular mass (kDa) with standard deviations. Theoretical mass of the heterodimer = 48,208.5 Da (NΔ23) + 8488.4 Da (P68) = 56,696.9 Da. (C) Crystal structure of RABV N∆230−P68 core complex (8b8v.pdb) in cartoon representation. N∆230 is shown in blue and P68 in red. The dotted line in P68 shows the position of the four residue loop that is less-well defined in the electron density map, while the dotted lines in N show the position of the missing loops in NNTD and the NCT-ARM. The N- and C-terminal residues of P68 are indicated. (D) Conservation of the N0−P interface. View of the region of interaction of residues 4 to 15 of PCM. The complex is shown with surface and conservation representations for N∆23 and with stick-and-ball representations for P68. The conservation in N derived from multiple sequence alignment is displayed on the surface of NiV N: blue low-level conservation, <20%; maroon, high-level conservation, >80%. The side chains of conserved residues in the P N-terminal region are shown in stick representation. (E) Conservation of the N0−P interface. View of the region of interaction of residues from 20 to 39 of PCM with same color scheme and representation as in panel (D). (F) Superposition of RABV N0−P and N−RNA structures. The structures were superposed by aligning the C-terminal domains of both structures. (G) Out-of-register construction in NNTD. Close-up view of a small region of NNTD illustrating the change of register of residues from 27 to 130 between the original circular N11−RNA structure (2GTT.pdb) shown in yellow and the N∆230−P68 structure (8B8V.pdb) shown in blue. (H) Interference of PCM binding with NNT-ARM and NCT-ARM binding. Close-up view of the interference between PCM (in red) and the NNT-ARM from the Ni-1 subunit (in olive) and NCT-ARM of the Ni+1 subunit (in green). (I) Interference of PCM binding with RNA binding. Close-up view of the interference between PCM in (red) and RNA (in orange). (J) Superposition of RABV N∆230−P68 and VSV NΔ210−P60 complex.

