Figure 6.
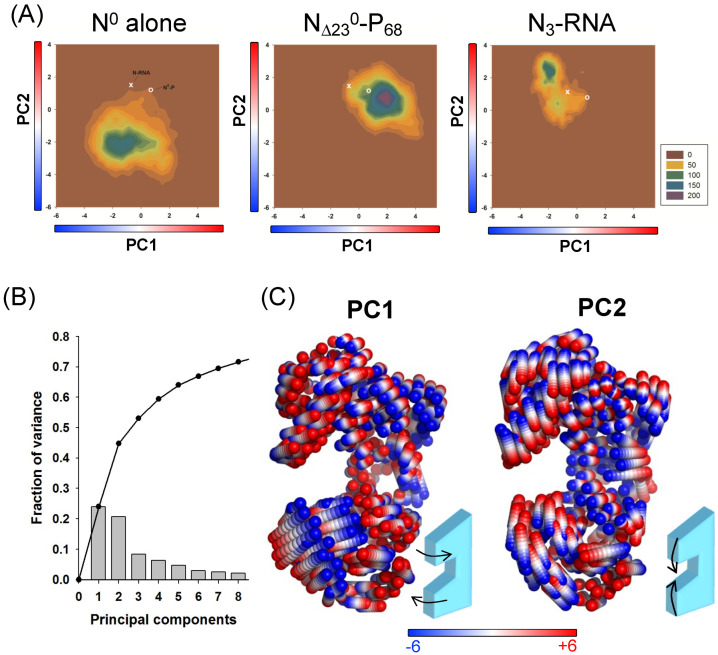
Molecular dynamic simulations. (A) Principal component analysis (PCA); 2D projections of the first two principal components (PCs) calculated for the N protein from MD simulations run with N0 alone (left panel), NΔ23−P68 (middle panel) and N3−RNA (right panel). The data are shown as a 2D histogram with the density distribution color scheme indicated on the right. The value calculated from the crystal structures of the N11−RNA complex and NΔ23−P68 complex are shown for reference on each graph as a white cross and a white circle, respectively. (B) Fraction of the variance captured by each PC (histogram) and cumulative contributions of the first eight PCs. (C) Collective motions of N captured by PC1 and PC2. The motions are illustrated as linear interpolations between the extreme projections of the structures onto the PCs. Each cylinder thus describes the path of a Cα atom between its extreme positions (on a red–white–blue color scale).

