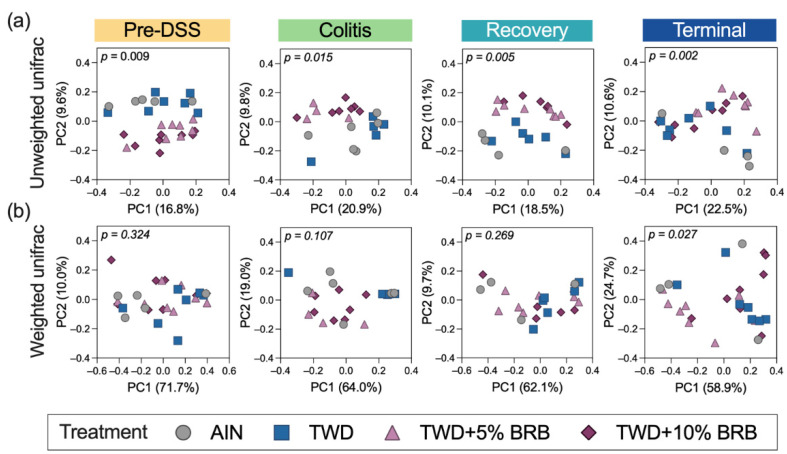
Figure 2.
Beta diversity of mouse microbiomes at each experimental time point (experiment A). Principal coordinate plots depicting fecal microbiome beta diversity using (a) unweighted or (b) weighted unifrac distances are shown with the two components. The variation attributed to PC1 and PC2 along with the permanova p-values are provided for each plot.

