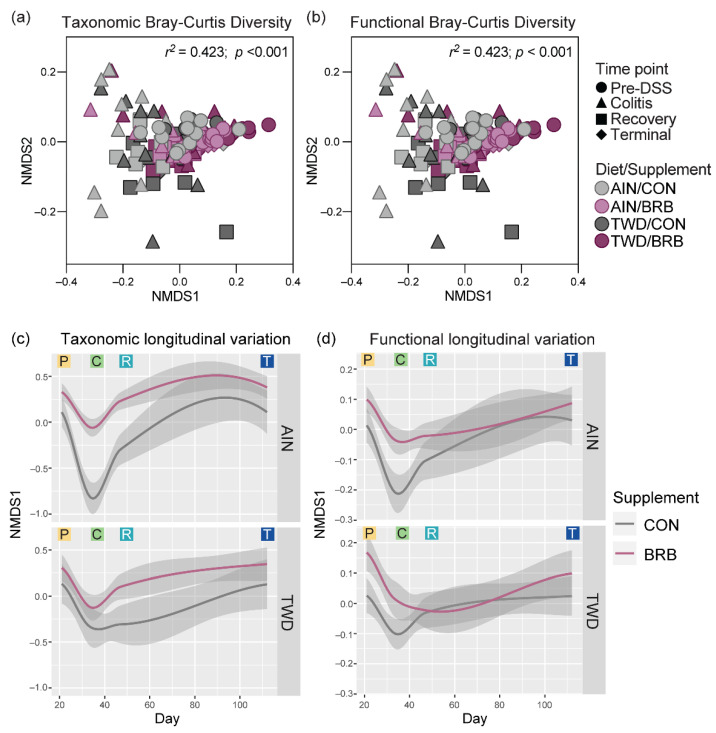
Figure 14.
Longitudinal analysis of fecal microbiome taxonomy and functional capacity (experiment B). (a,b) NMDS ordination plots of the taxonomic (a) and functional (b) β-diversity for fecal microbiomes of mice fed either CON or BRB-supplemented diet with either AIN or TWD basal diets for all experimental time points. Functional beta diversity was measured as the Bray–Curtis dissimilarity based on KEGG term abundances, while taxonomic beta-diversity values represent the Bray–Curtis dissimilarity based on ASV abundances. (c,d) Longitudinal variation shown as the first dimension plotted over experimental day for taxonomic (c) and functional (d) diversity. Loess-smoothed trajectories of microbiomes from each experimental group are plotted; gray shading represents the 95% confidence interval. P, pre-DSS; C, colitis; R, recovery; and T, terminal time points.

