Fig. 3.

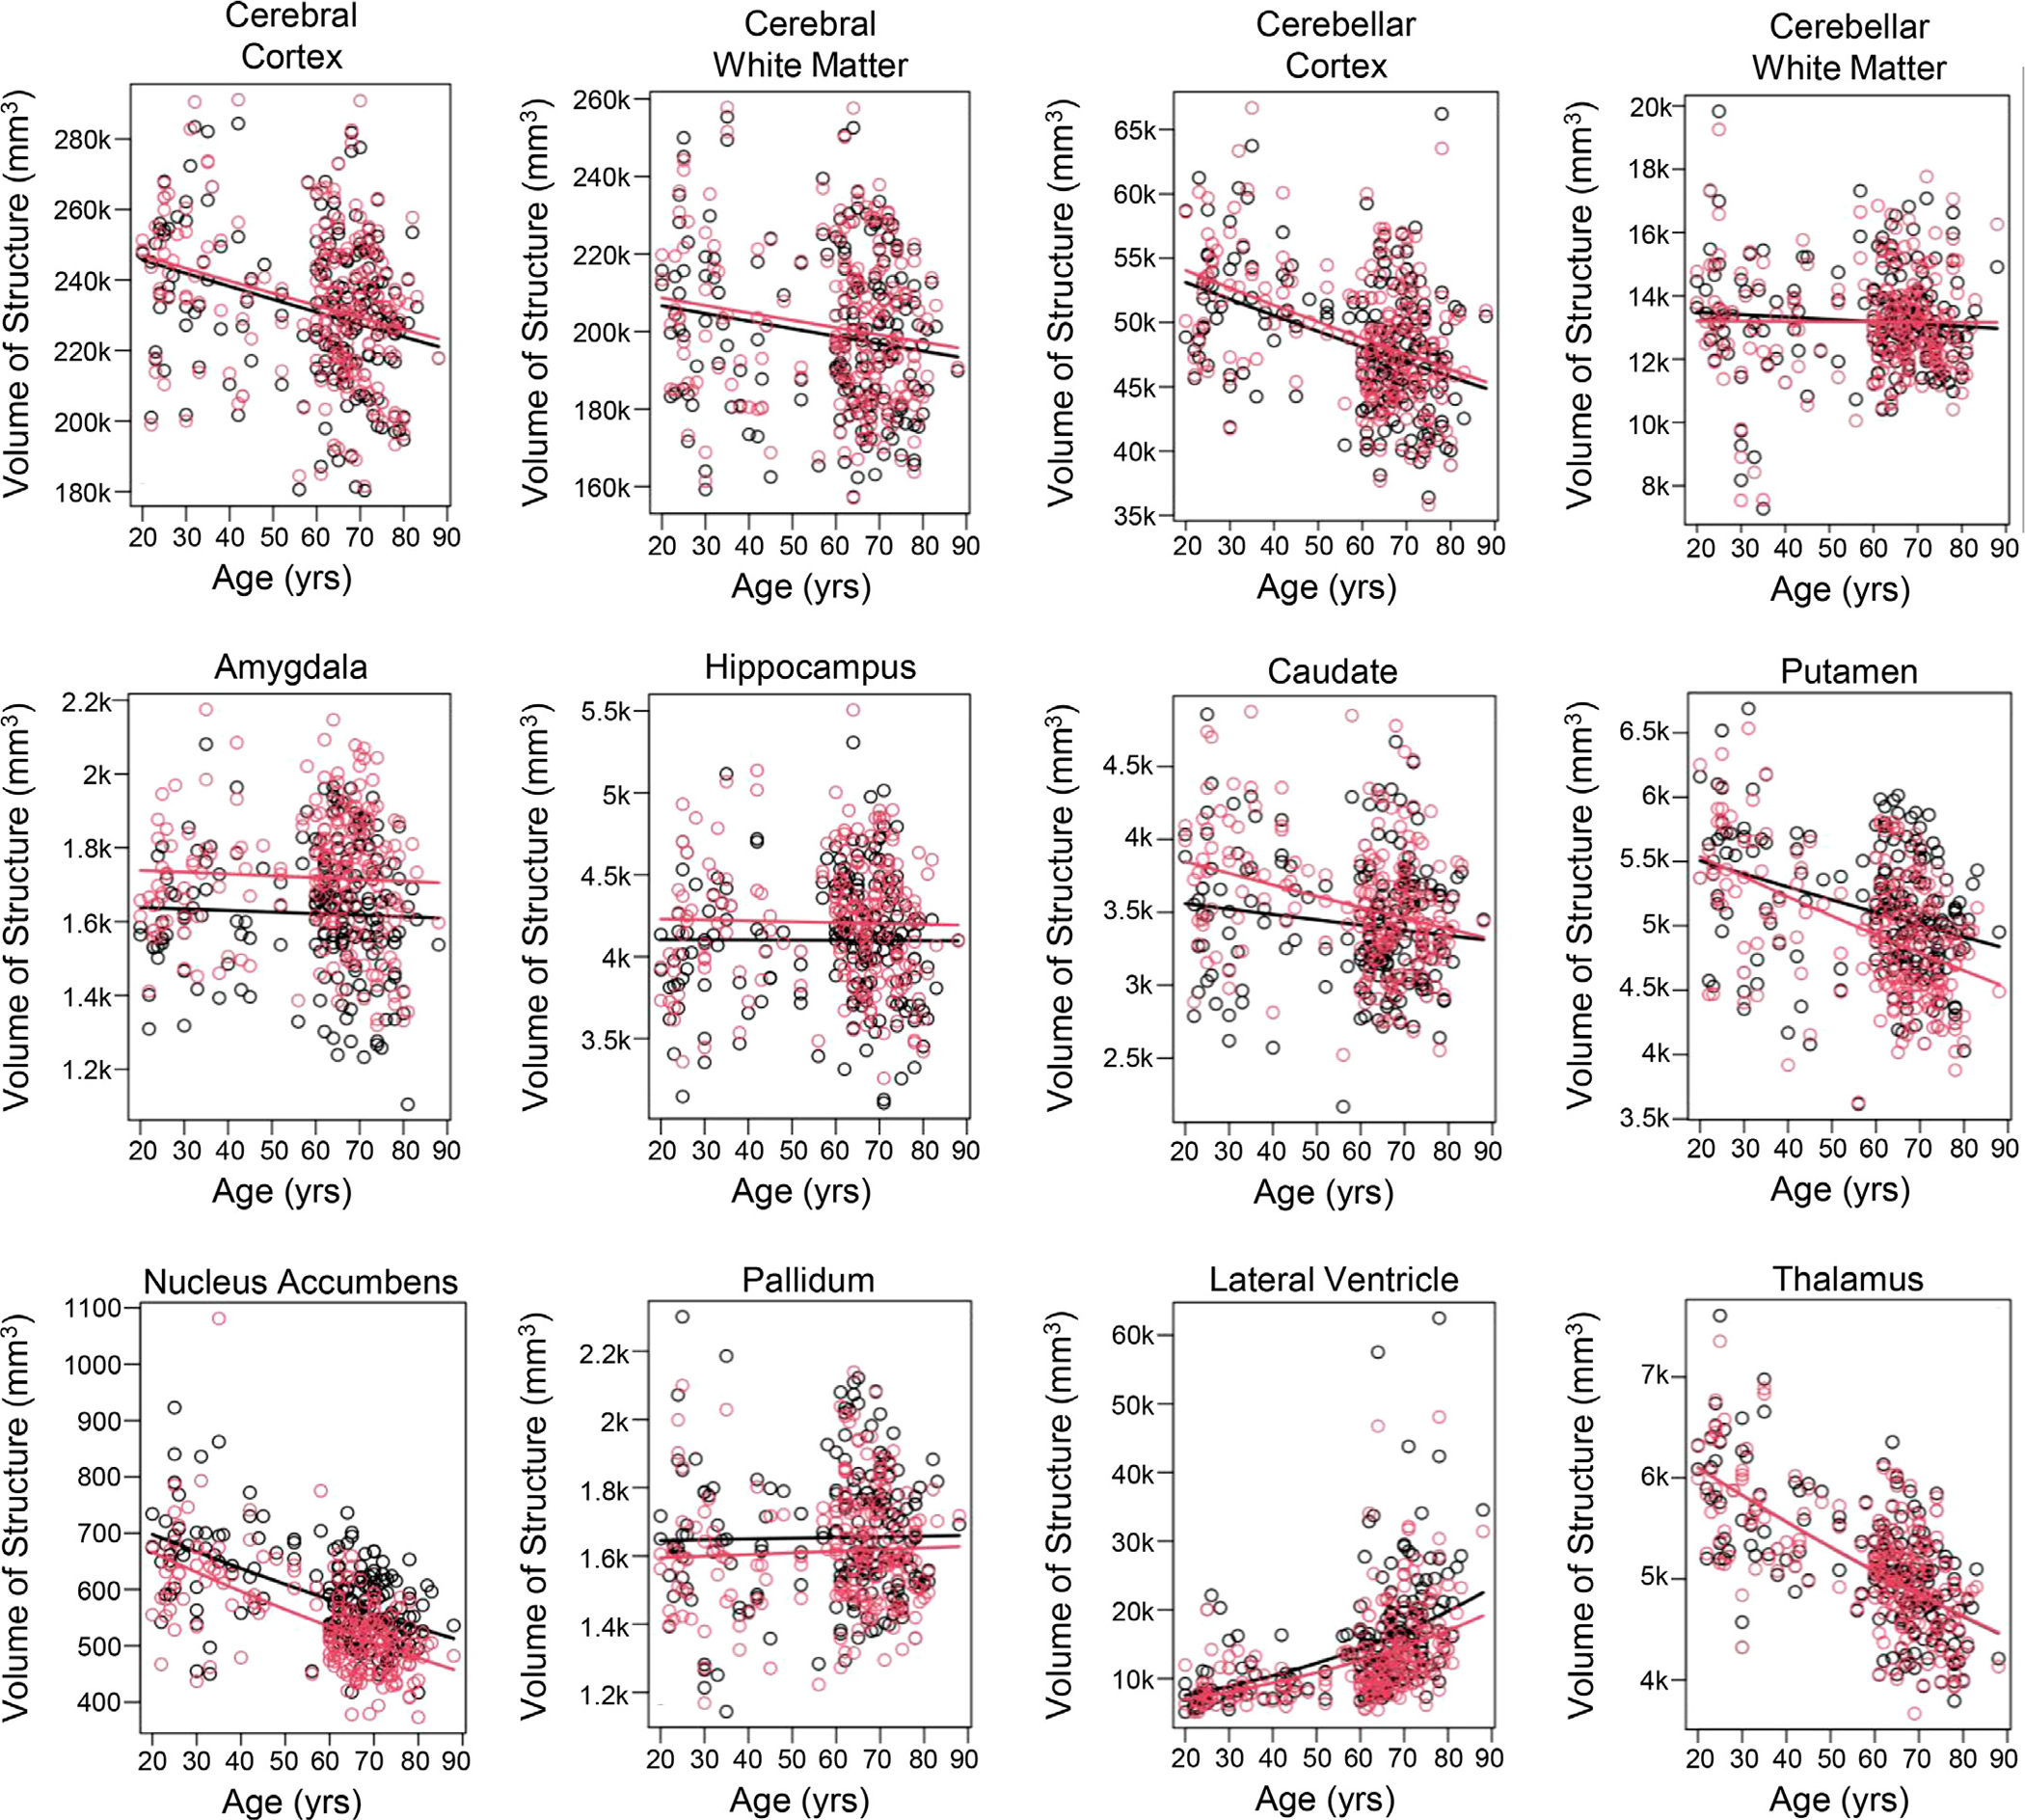
Absolute volumes of the whole thalamus and extra-thalamic structures plotted versus age. Curves show best fits to the defined exponential regression model. Red=right hemisphere. Black=left hemisphere.

Absolute volumes of the whole thalamus and extra-thalamic structures plotted versus age. Curves show best fits to the defined exponential regression model. Red=right hemisphere. Black=left hemisphere.