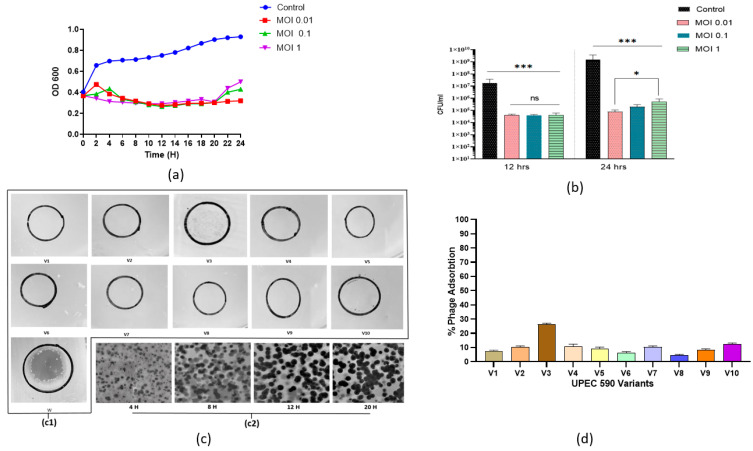
Figure 11.
(a) Lysis profile (time-kill assay) of MDR UPEC 590 phage and (b) the efficiency of formation of phage–resistant bacterial variants during the infection process with the addition of phage 590B at MOI 1.0, MOI 0.1, and MOI 1 after 24 h. (c)-(c1) Spot assay showing the activity of phage 590B against randomly selected 10 UPEC 590 variants (V1–V10) and 1 wild bacterial UPEC 590 isolate (w). (c)-(c2) Time-lapse plaque pattern study of phage 590B against wild UPEC 590 isolate. (d) Phage adsorption (%) pattern of 10 UPEC590 variants (V1–V10) over 15 min. The above experiments were performed in triplicate. The error bars indicate the standard deviation. The significant difference indicated by * p < 0.05 and *** p < 0.001. ns. not significant.

