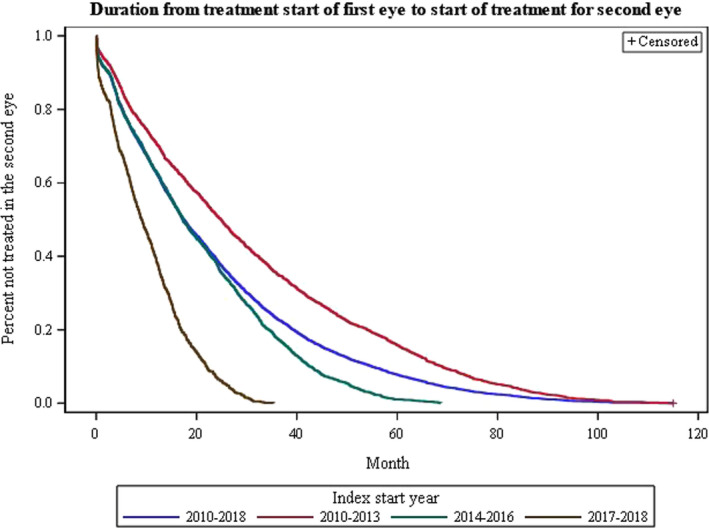
Fig. 1.

Kaplan‐Meier curve showing duration of treatment of the first eye before treatment start of the second eye for the different time periods. The number of patients; 2010–2018, n = 5218; 2010–2013, n = 2428; 2014–2016, n = 1946 and 2017–2018 n = 844. [Colour figure can be viewed at wileyonlinelibrary.com]
