

Abstract
Neural entrainment, or the synchronization of endogenous oscillations to exogenous rhythmic events, has been postulated as a powerful mechanism underlying stimulus prediction. Nevertheless, studies that have explored the benefits of neural entrainment on attention, perception, and other cognitive functions have received criticism, which could compromise their theoretical and clinical value. Therefore, the aim of the present study was [1] to confirm the presence of entrainment using a set of pre‐established criteria and [2] to establish whether the reported behavioral benefits of entrainment remain when temporal predictability related to target appearance is reduced. To address these points, we adapted a previous neural entrainment paradigm to include: a variable entrainer length and increased target‐absent trials, and instructing participants to respond only if they had detected a target, to avoid guessing. Thirty‐six right‐handed women took part in this study. Our results indicated a significant alignment of neural activity to the external periodicity as well as a persistence of phase alignment beyond the offset of the driving signal. This would appear to indicate that neural entrainment triggers preexisting endogenous oscillations, which cannot simply be explained as a succession of event‐related potentials associated with the stimuli, expectation and/or motor response. However, we found no behavioral benefit for targets in‐phase with entrainers, which would suggest that the effect of neural entrainment on overt behavior may be more limited than expected. These results help to clarify the mechanistic processes underlying neural entrainment and provide new insights on its applications.
Keywords: alpha rhythm, EEG, entrainment, endogenous oscillations, phase synchronization, temporal unpredictability
Short abstract
Our work contributes to the neural entrainment literature by addressing some prior methodological criticisms. We found evidence supporting the hypothesis that neural entrainment most likely cannot be explained by successive event‐related potentials. However, we found that the net effect of neural entrainment on overt behavior may be more limited than previously thought.
1. INTRODUCTION
The synchronization of internal oscillations to rhythmic external events, known as neural entrainment, is thought to help organisms anticipate the environment's temporal structure (Obleser & Kayser, 2019; Thut et al., 2011; Zoefel et al., 2018). In particular, the alignment of the high excitability phase of the neural oscillation with the onset of the periodic, sensory input, may explain this predictive benefit by amplifying the relevant information for preferential processing and suppressing the random, less meaningful inputs (Large & Jones, 1999; Schroeder & Lakatos, 2009; Haegens & Zion Golumbic, 2018; Zoefel et al., 2018; Lakatos et al., 2019, for review). Recently, neural entrainment has been postulated as a useful tool for diagnostic and therapeutic procedures (Guo et al., 2020; Lakatos et al., 2013, 2019; Thaut et al., 2015).
Notwithstanding, some criticisms to the proposal that neural entrainment constitutes an anticipatory mechanism could compromise its theoretical importance and clinical value. One criticism is that many experiments have not managed to successfully provide evidence that entrainment is produced by the synchronization of already existing endogenous oscillations to rhythmic external stimuli, rather than being the result of a succession of event‐related potentials (ERPs) (Capilla et al., 2011; Keitel et al., 2014; for review Zoefel et al., 2018). A second, important criticism is that, in past experiments, the temporal structure of the entrainer events as well as the underlying structure of the task did not change across trials, and therefore target onsets were highly predictable not only based on the entrainer periodicity, but also due to the time of target appearance. Under these conditions, behavioral benefits would most likely be a consequence of expectative mechanisms or high‐level attention orienting strategies, rather than neural entrainment (for review see Helfrich et al., 2019; Obleser & Kayser, 2019; Zoefel et al., 2018). Finally, it is crucial to note the proper use of terminology. Recently, several authors have stressed the importance of using the term neural entrainment only when certain predetermined criteria are met (Haegens & Zion Golumbic, 2018; Helfrich et al., 2019; Obleser & Kayser, 2019), and using a different term such as “entrainment in the broad sense”, “neural tracking”, or “rhythmic tracking” otherwise. This subtle but important distinction allows one to differentiate synchronization of an independent internal and external rhythm, from a more general rhythmic response that could be explained by a different mechanistic process, such as resonance (Helfrich et al., 2019). To counteract the criticisms and characterize the observed phenomena, the following requirements have been proposed to delineate neural entrainment in the narrow sense: [1] The endogenous neural oscillations, also known as eigenfrequencies, should occur spontaneously, without a driving, exogenous rhythm and synchronize to the external rhythm when the entrainer is present (Obleser & Kayser, 2019; Thut et al., 2011). [2] The neural oscillator should be resilient to perturbation, adapting its frequency within certain bounds (Obleser & Kayser, 2019). [3] Neural oscillators should not recover their eigenfrequency right away, rather they should remain at the entrained rhythm for a number of cycles, post‐entrainer offset (Obleser & Kayser, 2019; Thut et al., 2011).
Recent studies investigating neural entrainment‐related behavioral benefits have yet to resolve the criticisms highlighted above (Kösem et al., 2018; ten Oever et al., 2014; Wiesman & Wilson, 2019). A study by Kizuk and Mathewson (2017) explored the impact of neural entrainment on visual attention while addressing the first criticism. In their EEG study, participants discriminated the location of lateralized targets following a spatially informative cue and a stream of rhythmic, bilateral entrainers. Kizuk and Mathewson (2017) found the expected spatial attention advantage, and a rhythmicity effect so that targets presented in‐phase (in‐time) in contrast to the ones presented anti‐phase (out‐of‐time), with the entrainers were better detected, especially at unattended locations. Importantly, they observed that neural entrainment persisted for two cycles post‐entrainer offset even on target‐absent trials. These findings support the presence of neural entrainment. However, activity during target‐absent trials could still be contaminated, for instance by motor responses, given that participants were instructed to always guess a response. Furthermore, potential anticipatory confounds could be more exacerbated because the fixed length of the entrainer stream made target appearance highly predictable. Thus, despite using in‐phase and anti‐phase, the task did not completely address the second criticism about the potentially confounding effect of anticipation.
The aim of the present study was to examine whether endogenous oscillations synchronize to an external rhythm and meet the necessary requirements for neural entrainment, and whether the characteristic effects of this endogenous alignment continue to be observed when temporal predictability is strongly reduced. We reproduced the conditions in Kizuk and Mathewson (2017), but with a variable number of entrainers, increased target‐absent trials, and instructions for participants to avoid guessing and respond only if they detected a target. These changes increase temporal unpredictability, avoiding the contamination of target‐absent trials from motor response. The primary hypotheses of the present study were that, if the conditions for neural entrainment are met, then entrained, endogenous oscillations should persist and their effects on behavior, despite reducing temporal predictability. To test this, three hypothesis‐driven predictions were evaluated: (i) significant cross‐coherence between the external rhythm and the neural oscillatory activity, (ii) persistence of phase alignment after entrainer offset for at least two cycles, and (iii) behavioral benefits of entrainment as seen by higher hit rates and faster reaction‐times to targets in‐phase with the previous entrainers, as compared to anti‐phase.
2. METHOD
2.1. Participants
Thirty‐six right‐handed women (21.69 ± 2.06 years, range: 18–28 years) with normal or corrected‐to‐normal vision and hearing, and no previously diagnosed physical, neurological, or mental health conditions were initially selected to take part in this research study. The use of pharmaceutical or non‐pharmaceutical drugs was also considered as a criterion for exclusion. The present data were collected from the control group of a prospective, case–control study on migraine (manuscript in preparation). For this reason, after providing their informed consent and before the EEG recording, participants filled out the Adult ADHD Self‐Report Scale (ASRS) (Kessler et al., 2005) and the Beck Depression Inventory‐II (BDI‐II) (Beck et al., 1996). The entire session lasted approximately 3 h. At the end of the session, participants provided their payment details and were debriefed.
Six participants were discarded for the following reasons: mean false alarm rate > chance level 30% (N = 1), mean hit rate >90% on invalidly cued trials (N = 2; see Individual Detection Threshold section), technical problems (N = 2), and less than 50 trials per condition (see EEG analysis section) post‐EEG artifact rejection (N = 1). The final sample consisted of 30 individuals (21.70 ± 2.18 years, range: 18–28 years). Scores on the psychological measures related to attention deficit disorder (ASRS 1.73 ± 1.62) and depression (BDI‐II 4.83 ± 4.57) remained within the normal range. All participants gave their informed consent prior to participation and were compensated with 25€. This research was approved by the research Ethics Board at the Vall d'Hebron Hospital (PR [AG] 376/2017).
2.2. Procedure
The experimental sessions were performed in a chamber with acoustic and electromagnetic attenuation. The lights were dimmed, and participants sat at a distance of approximately 0.75 m from the screen throughout the entire procedure. A cued, visual detection paradigm, with bilateral entrainment (see Figure 1a), based on Kizuk and Mathewson (2017), was used to assess attention on target‐present and target‐absent trials. Stimuli were programmed and presented, using custom‐made scripts, with MATLAB R2015a and Psychophysics Toolbox Version 3.0.13 (Brainard, 1997; Kleiner et al., 2007), running on Windows XP. All stimuli were presented on a Sony Multiscan G520 Trinitron Color Monitor (CRT screen, resolution: 1024 × 768, 120 Hz refresh rate, background luminance: 21 cd/m2).
FIGURE 1.
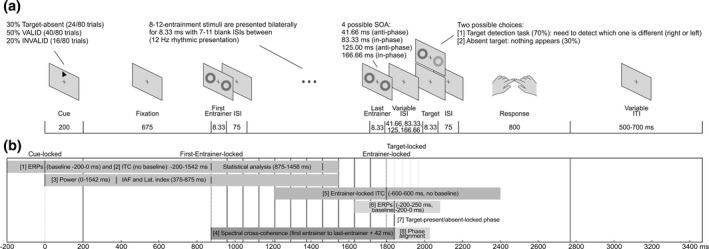
(a) Schematic illustration of a single trial of the cued, visual detection paradigm with bilateral entrainment. Participants were instructed to fixate on a central cross at all times. Each trial began with the appearance of a directional cue arrow pointing either to the right or to the left. After a fixed delay, a flashing sequence of synchronous bilateral annuli (entrainers) of variable length (8 to 12), with fixed inter‐stimulus intervals, was presented around the target location. The inter‐stimulus interval between the last entrainer and the target consisted of one of four possible options, with two target onsets occurring in‐phase and two anti‐phase with the rhythmic entrainers. On 70% of trials, otherwise referred to as target‐present trials, a target could be presented at the spatially valid location (gray) or the spatially invalid one (black) and consisted of the same bilateral annuli but with one of the annuli containing a Gabor patch. Gabor patch contrast was set to a 60% detection threshold using a single‐interval adjustment matrix prior to beginning the detection task. On the remaining 30% of trials, referred to as absent‐target trials, the target was absent, and no annuli or Gabor patch were presented. Finally, participants were asked to indicate using the appropriate response keys the side on which the target had appeared, or to withhold their response if they did not see a target. The next trial began after a variable inter‐trial interval. (b) Schematic illustration of the time windows used for each one of the analyses. For illustration purposes, entrainer stream length was fixed at 12 entrainers and target‐locked analyses were fixed to the first anti‐phase target onset. The first set of analyses were carried out using cue‐locked data and were comprised of the following and their respective time windows. [1] ERP/SSVEP analyses, time window: 200 ms to 1542 ms (baseline: −200 ms to 0 ms). [2] ITC analysis, same analysis as [1] but without a baseline. The time window of interest to assess that data were significantly concentrated throughout the entire entrainer stream was from 875 ms to 1458 ms (from the 1st to the 8th entrainer). [3] Power analyses to explore IAF and lateralized alpha activity, time window: 0 ms to 1542 ms, once again no baseline was employed. The spectral power for the IAF and time‐frequency for the lateralization index analysis were obtained from 375 ms to 875 ms. Additionally, [4] for the spectral cross coherence analysis, we selected from the onset of the first entrainer to the offset of the last entrainer plus one half‐cycle (+42 ms), which corresponds to the first anti‐phase target onset. The time window varied depending on the last entrainer (from 8 to 12). The next analysis was carried out using entrainer‐locked data and is presented with its respective time window. Please note, that due to the variable length of the entrainer stream, the last entrainer could correspond to either one of the ordinal values between 8 and 12. [5] ITC analysis, time window: −600 ms to 600 ms, no baseline. The final set of analyses were carried out on target‐locked (target‐present/target‐absent) data, along with their respective time windows. [6] ERP analyses, as a function of relative phase (anti‐phase/in‐phase) on target‐present and target‐absent trials, time window: −200 ms to 250 ms (baseline: −200 ms to 90 ms). [7] 12 Hz phase at target onset analysis. Here data were separately time‐locked to target onset times (target‐present trials) or to the moments in‐time where targets were expected to occur (target‐absent trials) and divided as a function of relative phase (anti‐phase/in‐phase). Finally, [8] to examine whether the phase continued aligned after the disappearance of the external rhythm, we restricted the analysis to target‐absent correct trials. The time window was selected to contain 3 cycles of possible target onset times, where 1 cycle was equivalent to one anti‐phase and consecutive in‐phase presentation. The specific time window was 41.5 ms to 250 ms with respect to the last entrainer. (c) Schematic illustration of the time windows used for the control analyses which were performed using STFT instead of complex Morlet wavelets. For illustrative purposes, entrainer stream length was fixed at 12 entrainers and only one of the multiple contrasts was shown for each analysis. Please, note than the time‐window and conditions employed for entrained‐locked ITC [1] and for the [2] phase analyses at target‐present/target‐absent trials were the same as described above. [3] Circular correlations between the phase obtained at the offset of the last entrainer (10 ms post‐onset) and the four target onsets (anti‐phase 1, in‐phase 1, anti‐phase 2, and in‐phase 2), on target‐absent trials. [4] Circular correlation between the 12 Hz phase 166 ms pre‐target onset and the reaction‐times for target‐present trials, separated as a function of the four possible target onset times (anti‐phase 1, in‐phase 1, anti‐phase 2, and in‐phase 2). [5] Phase (166 ms pre‐target) opposition analysis between correct and incorrect trials. The four possible target onset times were collapsed into two groups (anti‐phase and in‐phase) to ensure we had a sufficient number of trials
A black, fixation cross (height, width: 0.5°) was present throughout the entire duration of the experiment. Participants were asked to fixate on the cross throughout the entire duration of the trial, hence orienting their attention covertly. Each trial started with a black, directional arrow cue (isosceles triangle, height: 1°, width: 0.5°), which appeared 5.26° above the fixation cross for a duration of 200 ms, followed by a fixation period of 675 ms. After the fixation period, a stream of entrainers, of variable length (8–12; balanced across conditions, equiprobable within each block) was presented bilaterally at a rate of 12 Hz. The entrainers consisted of annuli (luminance: 7.3 cd/m2, 30.47% gray, external annulus diameter of 2.25°, internal annulus diameter of 1.25°, presented 1.13° above, and 4.1° to the left or right of the fixation cross), which were flashed on the screen for 8.33 ms and interleaved by blank intervals of 75 ms (hence, 83.33 periods for a 12 Hz rhythm). Entrainers were synchronous and of equal duration on both sides of the display. We varied the number of entrainers in each stream between 8 and 12, on a trial‐by‐trial basis, to reduce inherent task predictability.
After the last entrainer, a target was presented on 70% of trials, which consisted of two bilateral annuli (equal to the entrainers), but with a Gabor patch (spatial frequency: 1.68 cycles/pixel, orientation 90°; sigma 2.98 pixels; phase 0 cycles) on one side (for each block: 28 per cued side and 14 per SOA), whose contrast was set individually according to a detection threshold (see below). On the remaining 30% of trials, the target was absent and neither the annuli nor the resulting Gabor patch were presented (for each block: 12 per cued side and 6 per SOA). Participants were asked to respond to the target location on target‐present trials (left/right side, pressing the z and m keys with their left and right index finger, respectively), and withhold their response if they did not see a target (such as would be the case on target‐absent trials). Participants had a response deadline of 800 ms and were told to be conservative (refrain from guessing) if unsure, to prevent a high false alarm rate. The inter‐trial interval (ITI) was chosen randomly between 500 ms and 700 ms.
On target‐present trials, the target could appear at the location indicated by the spatial cue (valid trials, ~71%) or at the opposite location (invalid trials, ~29%). In addition, the rhythmic alignment of the targets was manipulated. The target could appear at four possible SOAs, two in anti‐phase with the rhythmic entrainers (41.66 ms and 125.00 ms) and two in phase with the entrainers (83.33 ms and 166.66 ms). This resulted in four main conditions: spatially valid anti‐phase, spatially valid in‐phase, spatially invalid anti‐phase, and spatially invalid in‐phase. At the beginning of the experiment, participants received extensive instructions to respond as quickly as possible while maintaining accuracy.
The experimental session consisted of nine blocks of 80 trials and lasted approximately 40 minutes. Prior to the entrainment task, participants practiced using a training task with easily detectable targets, comprising 12 trials with the same trial structure as the main task (three trials of each main condition, random order). During training their performance was monitored and feedback provided. The individual detection threshold was calculated upon successful completion.
2.3. Individual detection threshold
Stimulus contrast was adjusted to 60% of each participant's detection threshold using a single‐interval adjustment matrix (SIAM) (Kaernbach, 1990). To calculate this threshold, a modified version of the entrainment task was used where the number of entrainers was fixed to 10 and only spatially valid, in‐phase targets were presented. Participants were asked to indicate the side of target appearance as detailed above or withhold response in the perceived absence of a target. If the participant responded correctly (hit) the contrast was reduced according to the step size on the next trial. If they responded incorrectly (miss or false alarm) the contrast was increased by the step size on the next trial. An adjustment matrix was used to determine the step size of the resulting increment/decrement as a function of the number of reversals. Step size was set at 0.01 and was multiplied by four for the first and second reversal (step size: 0.04), by two for the third (step size: 0.02), and then maintained at 0.01 until all the reversals were complete. Once a total of 12 reversals were reached, the threshold procedure ended. The contrast values obtained during the last four reversals were averaged to calculate the final mean threshold. A separate threshold was obtained for both left and right sides. Participants with a mean hit rate higher than 90% were not considered for the study to guarantee that the spatial validity effect would be detectable and to avoid ceiling effects (Kizuk & Mathewson, 2017).
2.4. EEG recording
Continuous EEGs (digitized, 500 Hz sampling rate, no online filters) were acquired using a BrainAmp Standard (001 10/2008) amplifier, connected to an actiCHamp Control Box (Brain Products). Data were recorded using 64 active electrodes (10–10 system). An online reference electrode was placed on the tip of the nose whereas a ground electrode was positioned at AFz in the cap. External electrodes included: left and right mastoids and vertical and horizontal electrooculograms. Impedances were kept below 10 kΩ.
2.5. Analyses
This study followed a within‐subjects design comprised of one session per participant and was not preregistered.
2.5.1. Hazard rate
In order to obtain an objective index of task predictability and compare this index with that of Kizuk and Mathewson (2017), we decided to calculate the Hazard Rate (HR) for each target time of both tasks. We used the formula employed by Pasquereau and Turner (2015) to calculate the HR, which consisted of the probability that a target will occur at time t divided by the probability that it has not yet occurred:
where ƒ(t) referred to the probability distribution of target times and F(t) is the cumulative distribution of probabilities. It is important to take into account, that our task was comprised of entrainer streams of varying lengths (five different time windows in total) and four different target appearance times post‐last entrainer. Therefore, our design consisted of 12 temporal moments, from 625 ms to 1083 ms, between offset of the first entrainer and the appearance of a target.
2.5.2. Behavioral analyses
We calculated hit rates, and RTs between spatially valid and invalid trials at each of the four SOAs (see Figure 2a–d). Trials with RTs < 100 ms or three standard deviations above the participant's mean RT on the condition (valid/invalid SOA pairings) were removed from further analyses (1.17 ± 1.00% of total trials on average, range: 0–3.04). The resulting data were analyzed to examine the effects of spatial validity and relative phase. The four SOAs were collapsed into in‐phase and anti‐phase conditions for the analysis. For hit rates and RTs, we ran two (spatial validity: valid/invalid) × 2 (relative phase: anti‐phase/in‐phase) repeated measures analyses of variance (rmANOVAs) where both factors were within‐subjects. Post hoc t tests were carried out as needed. To correct potential violations of sphericity and estimate epsilon accordingly (Jennings & Wood, 1976), we used the Greenhouse–Geisser epsilon correction and the resulting, adjusted p values were reported. Cohen's d and f statistics were also calculated as measures of effect size for t tests and rmANOVAs, respectively (Cohen, 1992). We reported Bayes factors (BF10) for the rmANOVAs, which indicate whether the data provide evidence for the alternative model (H1) as compared to the null model (H0) (i.e., probability of the data given H1 relative to H0). This analysis was performed with JASP software, using the null model (Morey et al., 2017; Wagenmakers, Love, et al., 2018; Wagenmakers, Marsman, et al., 2018). For the model, we included spatial validity and relative phase as factors as well as their interaction.
FIGURE 2.

(a) Line graph of the mean hit rates and standard errors of the mean, as a function of relative phase (x axis) and spatial validity (separate lines). (b) Violin plots of the hit rates, separated as a function of spatial validity, while collapsing the four possible target onset times into two relative phases (anti‐phase and in‐phase). Dots represent individual data, the central squares the median, and vertical lines the interquartile range. (c) Line graph of the mean reaction‐times and standard errors of the mean, as a function of relative phase (x axis) and spatial validity (separate lines). (d) Violin plots of the reaction‐times, separated as a function of spatial validity, while collapsing the four possible target onset times into two relative phases (anti‐phase and in‐phase). Dots represent individual data, the central squares the median, and vertical lines the interquartile range. Line and bar colors indicate spatial validity (valid: dark gray, invalid: light gray). (e) Hazard Rate (HR) at each of the 12 times of our task and for the four times of Kizuk and Mathewson's (2017) task. (f) Violin plot of the IAF obtained between 5 and 15 Hz at the selected ROI. An alpha peak was detected in all participants with one exception
We also added a metric to assess whether or not the participants in our study held a response bias, in either direction (more to less conservative). This measure is the response criterion, sometimes termed decision criterion, which is the mean of the z score of the hit rate and the z score of the false alarm rate (Azzopardi & Cowey, 1998).
2.5.3. EEG preprocessing
EEG data analyses were performed using EEGLAB 13.5.4b (Delorme & Makeig, 2004), ERPLAB 7.0.0 (Lopez‐Calderon & Luck, 2014), and FieldTrip version 20,161,103 (Oostenveld et al., 2011) toolboxes as well as MATLAB R2015a custom‐made scripts. EEG activity was re‐referenced offline to the mean activity of both mastoids. An offline 50 Hz notch filter (type Parks‐McClellan: padding factor: 2, smoothing factor: 50, sliding window length: 4, sliding window step: 1, order: 180) was applied to each recording. Phase analyses were performed without further preprocessing. For ERP analyses only, an offline Hamming windowed sinc finite impulse response (FIR) band‐pass filter (zero‐phase), from 0.1 to 40 Hz, was applied (high‐pass: Frequency 0.1 Hz, order 16501, cutoff −6 dB; low‐pass: frequency 40 Hz, order 167, cutoff −6 dB). It is important to note that no filters were used for inter‐trial coherence (ITC), phase, and power analyses.
2.5.4. EEG analyses
Please see Figure 1b for a detailed pipeline of EEG analyses and specific time windows. EEG activity was analyzed using five different time windows centered on different trial events. (1) Cue‐locked analyses (from −200 ms to 1542 ms, with respect to the cue) included ERPs, power spectrum for the individual alpha frequency (IAF), time‐resolved ITC, and power. (2) Cross‐coherence analysis, from the onset of the first entrainer to the offset of the last entrainer plus one half‐cycle (+42 ms). (3) Entrainer‐locked analyses (from −600 ms to 600 ms, with respect to the last entrainer), which focused on ITC alone. (4) Target‐locked analyses (−200 ms to 250 ms, with respect to the target onset), included ERPs and phase alignment at the entrainer frequency (12 Hz) at target onset times (for target‐present) and times where targets should occur (for target‐absent trials). (5) Phase alignment in the absence of external signal, which included three cycles of possible target onset times (a time window of interest from 41.5 ms to 250 ms, with respect to the last entrainer). These specific analyses are detailed below. In order to ensure that endogenous activity corresponded to trials where participants were attending to the task, only correct trials (i.e., hits and correct rejections) were included in the analyses. A minimum of 50 artifact‐free trials for each condition was required, in order to have a non‐biased estimation of the ITC (Aydore et al., 2013). For the ITC, phase alignment, and power analyses, data were reepoched with 2000 ms at both ends of the time window (or point) to avoid edge artifacts. Ocular (horizontal eye movements and blinks at points of interest) and muscular artifacts were removed through a process of visual inspection, using concatenated windows, which included cue‐locked, entrainer‐locked, and target‐locked data. Once the artifact rejection was complete, all of the electrophysiological analyses, with the exception of the lateralized alpha activity analysis, were first carried out on the Pz electrode, to replicate (Kizuk & Mathewson, 2017). Results for the Oz electrode, where maximum ITC was observed, are also provided.
2.5.5. IAF estimation
To estimate the IAF during the task, we selected the cue‐locked epochs described above. Next, we calculated the power spectrum using a Short Time Fourier Transform (STFT, Hanning window, 4–30 Hz in 0.1 Hz steps, zero‐padded to 10 s, time window: 375–875 ms post‐cue). This time window was determined to avoid including ERP activity related to the cue and to ensure that we had enough cycles to estimate the frequencies of interest. The power spectrum was averaged across the electrodes of interest (PO3, POz, PO4, PO7, PO8, O1, Oz, and O2), and background noise was estimated by fitting a 1/fa curve to the power spectrum (Haegens et al., 2014; Torralba Cuello et al., 2022). A window between 5‐ and 15 Hz was used to calculate the individual alpha frequency peak.
2.5.6. Event‐related potentials
We extracted ERPs and Steady‐State Visual Evoked Potentials (SSVEPs), for cue‐locked analyses, from −200 ms to 1542 ms (baseline −200 ms to 0 ms), collapsing across target‐present/target‐absent trials given that this time window did not extend into the target period. For target‐locked analyses, we calculated ERPs as a function of relative phase (anti‐phase/in‐phase) on target‐present and target‐absent trials from −200 ms to 250 ms (baseline −200 ms to 0 ms).
2.5.7. Inter‐trial coherence
We examined whether the effect of entrainment began with the first entrainers, continued throughout the entrainer period, and extended beyond the entrainers into the target‐present/target‐absent time windows. We obtained activity, locked to the onset of the cue (cue‐locked) and to the onset of the last entrainer (entrainer‐locked), respectively. Single‐trial EEG epochs were convoluted via frequency‐domain multiplication, in which the Fourier‐derived spectrum was multiplied by the spectrum of a complex Morlet wavelet (variable number of cycles, 4–10 in logarithmic steps, wavelet time −2 to +2 s), and the inverse Fourier transform was taken. A separate time series of complex wavelet coefficients was obtained for each frequency, with a linear increase from 1 to 40 Hz, in 1 Hz steps. These complex coefficients, containing both real and imaginary components, were used to derive the ITC (Cohen, 2015), for each trial, time point, frequency, and participant. ITC is an index that measures phase consistency across trials, it can take values ranging from 0 (randomly distributed phases) to 1 (perfectly aligned phases). For cue‐locked epochs (from −2200 ms to 3542 ms, window of interest −200 ms to 1542 ms), ITC was calculated mixing epochs from both target‐present and target‐absent correct trials. For entrainer‐locked epochs (from −2600 ms to 2600 ms, window of interest from −600 ms to 600 ms), ITC was separately obtained for target‐present and target‐absent correct trials, collapsing anti‐phase and in‐phase trials. No baseline was used.
To statistically assess that data were significantly concentrated throughout the entire entrainer stream, we used a Montecarlo permutation test (Maris & Oostenveld, 2007) on cue‐locked data (from the 1st to the 8th entrainer, or a time window of interest from 875 ms to 1458 ms). Null ITC distributions were calculated for each participant and electrode of interest separately. Furthermore, for each trial, a phase from a random time inside the window of interest was selected. A surrogate ITC was calculated for the randomly selected phases (thus maintaining the number of trials). This procedure was repeated 10,000 times for each subject to obtain a distribution of surrogate ITCs. The surrogate ITC distributions were then averaged across subjects, and a p value (unbiased; Ernst, 2004) was obtained by computing the proportion of group‐averaged surrogate ITCs that exceeded the measured ITC. Lastly, we ran a false discovery rate‐based multiple comparison procedure (FDR) on the time series of p values to correct for multiple comparisons (Benjamini et al., 2001). Finally, corrected p values were inspected using an alpha of 0.05 as the cutoff for significance.
2.5.8. Spectral cross‐coherence
To provide additional evidence for entrainment, we performed a cross‐coherence spectral analysis between the EEG activity and the entrainers (Keitel et al., 2017). Given that cross‐coherence is a measure of the alignment between two signals (EEG activity and entrainers in our case), we expected a peak in the cross‐coherence at 12 Hz. Epochs were classified based on the number of entrainers on each trial (8 to 12). For each type, we selected from the onset of the first entrainer to the offset of the last entrainer plus one half‐cycle (+42 ms). Only correct trials were analyzed. Then, the next steps were separately performed for each epoch length: (i) For the purpose of this analysis, an artificial 12 Hz spiking signal was created. (ii) The entire spectrum was obtained using a STFT (2.048 s padding, Hanning window, frequency range 1 Hz to 40 Hz), for the empirical and the artificial signals, separately. (iii) Finally, the spectral cross‐coherence value between the empirical and the artificial signal was obtained for each channel, frequency, and participant using the ft_connectivityanalysis function in the FieldTrip toolbox for EEG‐MEG analysis.
Next, we calculated the weighted arithmetic mean of the cross‐coherences across the five entrainer lengths (weighted by the number of trials per length), which resulted in a cross‐coherence value for each frequency and participant. To assess the statistical significance of the peak at the entraining frequency (12 Hz), we used the procedure described by Biltoft and Pardyjak (2009). For the FFT estimation we employed 1024 samples, and we obtained an average number of trials of 351 ± 83 with a mean length of 418 points (335 for eight entrainers to 502 for 12 entrainers). At 500 Hz sampling rate, this results in degrees of freedom equal to 143. The cutoff for significance was established as a p value of <0.05, which implied a peak height of 0.0416 at 12 Hz.
2.5.9. 12 Hz phase at target onset on target‐present and target‐absent trials
To assess phase opposition during the target period, EEG data from correct trials were time‐locked to target onset or where target onset should occur, for target‐present and target‐absent trials respectively, as a function of in‐phase and anti‐phase temporal moments. The selection of target‐absent trials was crucial to examine the effect of prior entrainment on the resulting phase without the contamination of ERP resulting from the presence of targets. For this analysis, epochs were selected from −2000 to 2000 ms, centered at the target onset (target‐present trials) or where target onset should occur (target‐absent trials). A minimum of 50 artifact‐free trials per condition was required for each participant. Separately for each condition and participant, single‐trial phases were obtained at 12 Hz. Next, a circular V‐test (Durand & Greenwood, 1958), with phases pooled over all trials and participants, was performed to test whether there was a 180° separation between anti‐phase and in‐phase trials. In a complementary analysis used only for descriptive purposes, the mean angular difference between anti‐phase versus in‐phase trials was calculated for each participant, on target‐present and target‐absent trials. Circular statistics performed throughout the manuscript were obtained using the Circular Statistics Toolbox 1.21 (Berens, 2009).
2.5.10. Phase alignment in the absence of external signal
To provide additional evidence for entrainment, we examined whether the phase alignment of the internal oscillators with the external signal was maintained even after the disappearance of the external rhythm. To evaluate this, we used a similar procedure to the one used for cue‐locked ITC data (see above). Here, we restricted the analysis to target‐absent, correct trials. The time‐window of interest was 41.5 ms to 250 ms after the last entrainer, which corresponds to three cycles of possible target onset times, where one cycle was equivalent to one anti‐phase and consecutive in‐phase presentation. Statistical significance was assessed using a Montecarlo procedure equivalent to the one described in the section titled Inter‐Trial Coherence (ITC).
2.5.11. Control analyses
To avoid temporal smearing of evoked activity and to improve temporal resolution, we performed five control analyses, in which we estimated ITC and time‐resolved phase at 12 Hz with a STFT of 166 ms length (two cycles of the frequency of interest), using a Hanning window to minimize spectral leakage (see Figure 1 for more detail about these analyses). Please, note that phases were free of contamination, apart from those at anti‐phase 1.
For the first analysis, (i) we obtained ITC locked at the last entrainer during target‐present and target‐absent trials, using the same windows as the ones used with complex Morlet wavelets, which consisted of −2600 ms prior and 2600 ms after the first entrainer. We repeated the same phase concentration analysis as previously described for the complex Morlet wavelets.
Then, we carried out a series of analyses based on 12 Hz phase. For these analyses, we centered the activity at the temporal points mentioned below, and we added 2000 ms at each side. (ii) Phase opposition analyses between anti‐phase and in‐phase trials, at target onset (or where target onset should occur), were separately performed on target‐present and target‐absent conditions. Please, note that the statistical analyses were exactly the same as the ones performed with complex Morlex wavelets.
Next, to give additional support for the presence of entrainment, (iii) we carried out circular correlations between the phase obtained at the offset of the last entrainer (10 ms post‐onset) and at the four temporal time points where targets should occur (anti‐phase 1, in‐phase 1, anti‐phase 2, and in‐phase 2), on target‐absent trials. Data were calculated for each trial and participant. We combined the resulting p values across participants, using the Fisher method (Fisher, 1925), which provided us with a vector of p values as a function of time.
To explore the effect of 12 Hz phase on performance, we carried out two extra control analyses. In both cases, EEG data were time‐locked to 166 ms pre‐target and was divided both as a function of possible target onset time (anti‐phase 1, in‐phase 1, anti‐phase 2, in‐phase 2) and response type (correct, incorrect). 12 Hz phase was calculated for each target onset, response type, trial, and participant. Furthermore, RTs for each trial were obtained. (iv) First, a circular correlation between 12 Hz phase and the RT was obtained for each participant and target onset time. p values were combined across participants, using the Fisher method (Fisher, 1925), to obtain a single p value for each target onset. (v) Finally, we carried out a phase opposition analysis between correct and incorrect trials. The four possible target onset times were collapsed into two groups (anti‐phase and in‐phase) to ensure we had a sufficient number of trials. For each participant, we computed the difference between the mean angle of correct and incorrect trials for each target onset and carried out a circular V‐test (Durand & Greenwood, 1958) to test for 180° separation.
2.5.12. Reality check: Lateralized alpha activity
To verify that subjects were indeed orienting attention, we analyzed the preparatory lateralization of the oscillatory alpha activity during the cue to target interval. We separately obtained epochs for cue‐left/cue‐right conditions (from −2200 ms to 3542 ms, window of interest from 0 ms to 1542 ms post‐cue, no baseline was used) for valid, correct trials only, to ensure that participants were in fact orienting attention. For this analysis, the mean spectral power was calculated from the time window 375 ms to 875 ms after the cue onset, which corresponds to the 500 ms before the onset of the first entrainer. A FFT (zero padding to 1 s, Hanning window) was used to extract power in this time window of interest. Power was calculated for two ROIs of parieto‐occipital electrodes (Thut et al., 2006; Worden et al., 2000). A left ROI (P3, PO3, PO7, P7, P5, P1, PO9, and O1) and a right ROI (P4, PO4, PO8, P8, P6, P2, PO10, and O2) were used. The average alpha power (7–14 Hz) for the electrodes ipsilateral and contralateral to the cue on both left and right cue (attended‐left/attended‐right) trials was computed. Next, an index of alpha lateralization was obtained by subtracting the previously obtained attended‐left average alpha power (ipsi left‐contra left) to the attended‐right average alpha power (ipsi right‐contra right) and dividing by the sum of the two (Thut et al., 2006). Finally, we ran a one‐sided (right), paired t test against zero, to assess the statistical significance of the lateralization index. For illustrative purposes, the whole spectral power analysis was repeated (−2200 ms to 3542 ms time window) using a complex Morlet wavelet as described above for the ITC. The index of alpha lateralization was obtained for the entire window. Please notice that Morlet wavelets were not used in the reality check to make sure that the latency of interest was not contaminated by post‐entrainer activity.
3. RESULTS
3.1. Hazard rate
We obtained the HR to have an objective metric related to task predictability (see Figure 2e). We observed a low intercept and noted that the HR was quite similar between the first and last conditions. When this metric was calculated for the original paradigm (Kizuk & Mathewson, 2017) a higher intercept and higher overall values were recorded. Furthermore, there was a large difference between the HR of the first and later targets, a common bias in temporal attention paradigms. In comparison, our task clearly reduced this bias and increased unpredictability across target presentation times.
3.2. Behavioral analyses
In order to explore spatial and temporal effects on performance, accuracy (hit rates) was separately obtained as a function of spatial validity (valid vs. invalid) and relative phase (anti‐phase vs. in‐phase) (see Figure 2a,b ). An rmANOVA was conducted with spatial validity (valid/invalid) and relative phase (anti‐phase/in‐phase) as within‐subject factors. Please note that the two anti‐phase and in‐phase SOAs were collapsed into two‐levels: anti‐phase and in‐phase. The rmANOVA returned a significant main effect of spatial validity, F(1,29) = 22.166, p = −5.7 × 10⁻⁵, f = .874, BF 10 = 2.1 × 10¹¹, with higher hit rates on valid trials (62.0 ± 19.5%) as compared to invalid ones (40.6 ± 26.6%). On the other hand, there was no significant main effect of relative phase, F(1,29) = 1.448, p = .239, f = .225, BF 10 = .261, indicating that there was no difference in hit rates between anti‐phase (M = 56.5 ± 17.7%) and in‐phase (M = 55.3 ± .19.8%) conditions. No significant interaction was detected between spatial validity and relative phase, F(1,29) = .016, p = .901, f = .032, BF 10 = .284. Please note that Bayes Factors estimates indicated that there was strong evidence in favor of H1 for spatial validity and moderate evidence in favor of H0 for temporal validity and for the interaction between spatial validity and temporal validity.
The RTs on correct trials were analyzed using the same model, which included spatial validity (valid/invalid) and relative phase (anti‐phase/in‐phase) (see Figure 2c,d). Two of the participants' data were not accounted for in this analysis because they did not have any correct responses on invalid conditions, hence no RT average could be calculated (this was not a criterion for exclusion from remaining analyses). The rmANOVA indicated a significant main effect of spatial validity, F(1,27) = 43.432, p = 4.5 × 10⁻⁷, f = 1.269, BF 10 = 1.3 × 10⁹, with faster responses to validly‐cued trials (454.5 ± 14.0 ms) as compared to invalid ones (493.1 ± 14.5 ms). Once again, the main effect of relative phase remained not significant, F(1,27) = .968, p = .334, f = .190, BF 10 = .217, indicating that RTs were not modulated by anticipation based on preceding entrainers given that there was no significant difference between anti‐phase (458.0 ± 14.3 ms) and in‐phase (462.7 ± 13.7 ms) trials. The interaction between spatial and relative phase was also not significant, F(1,27) = .257, p = .616, f = .095, BF 10 = 0.287. Similarly, to the results obtained for accuracy, for RT data, according to the resulting Bayes Factors estimates, there is strong evidence in favor of H1 for spatial validity and moderate evidence in favor of H0 for temporal validity and for the interaction between spatial validity and temporal validity.
In order to explore whether or not the participants in our experiment held a response bias, in either direction, the response criterion was calculated. The results indicated a lack of response bias as the response criterion was approximately equal to 0 (c = −4.5103 × 10⁻¹⁷).
3.3. Individual alpha frequency
Next, we examined the IAF using a violin plot and corroborated that a large proportion of the data, as seen by the shaded area representing a kernel density estimation and the respective median and IQR values (Mdn: 10.80 Hz, IQR: 9.25–12.35 Hz) was concentrated around 11 Hz, very close to the entrained 12 Hz frequency (see Figure 2f).
3.4. Cue‐locked EEG data analyses
Given that it was not possible to depict an entire trial in one figure due to the variable number of entrainers and the four possible target onset times, we presented our data locked at different temporal points, throughout the manuscript. Here, to visualize the effects of entrainment on ERPs and ITC (see Figure 3), we time‐locked EEG epochs from −200 ms to 1542 ms (baseline −200 ms to 0 ms), at Pz and Oz electrodes, during the presentation of the first eight entrainers (common to all trials). Valid and invalid target‐present and target‐absent trials were collapsed for this analysis. We observed an alignment of visual ERPs to entrainer onset times. Furthermore, and continuing with the visual inspection, we noticed an increase in ITC at the frequency of interest (12 Hz) and the persistence of this activity over the entire duration of the entrainer presentation period provided support for the presence of entrainment. Although the effect was visible at Pz electrode, entrainment appeared to be even stronger, in terms of heightened ITC and increased alignment of SSVEPs with entrainer onset times, at the Oz electrode. See next paragraph for the statistical analysis on cue‐locked data.
FIGURE 3.
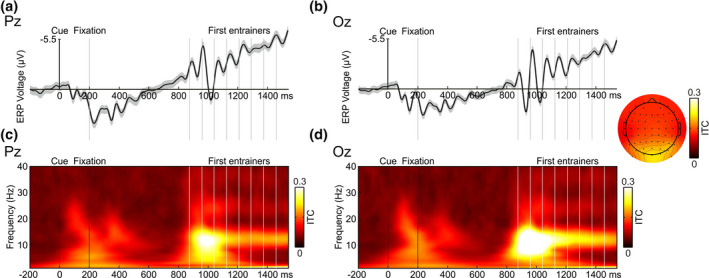
(a) Cue‐locked grand average ERP with its SEM at Pz electrode. (b) Cue‐locked grand average ERP with its SEM at Oz electrode. (c) Cue‐locked ITC at Pz electrode. (d) Cue‐locked ITC at Oz electrode. The time window selected for these graphs was −200 ms to 1542 ms (baseline from −200 ms to 0 ms). The cue, fixation cross, and first eight entrainers are depicted as vertical lines. Only correct trials were included, and epochs were collapsed across relative phase and spatial validity, as well as target‐present and target‐absent trials. An increase of ITC around 12 Hz was clearly observed throughout the entrainer period. A topographical map of the ITC at 10–14 Hz during the time‐period comprising the first to the eighth entrainer is depicted
Post visual inspection, a statistical analysis was performed to evaluate the effects of entrainment. For this purpose, on cue‐locked EEG data, and collapsing for valid and invalid, and for target‐present and target‐absent trials, a Montecarlo permutation test was performed to corroborate that the phase values were concentrated throughout the entrainment period (from the 1st to the 8th entrainer, or a time window of interest from 875 to 1458 ms). After correcting for multiple comparison, p values were statistically significant, according to the predefined alpha significance value of p < .05 at all examined time points at both Pz and Oz electrodes. The analysis thus provided evidence for phase alignment of the internal oscillatory activity with the external signal across the entrainment period.
3.5. Cross‐coherence between entrainers and EEG response
Continuing the statistical analysis of entrainment during entrainer presentation (see Figure 1), we used cross‐coherence to determine whether the experimental paradigm successfully entrained neural oscillations to the external frequency. After having extracted the coherence for all frequencies and averaging across trials and participants, the output was examined for the presence of a peak at 12 Hz. This resulted in an average peak height of 0.24 (Pz) and 0.28 (Oz) at 12 Hz, with a p = 5 × 10⁻⁹ and p = 10−10, for Pz and Oz electrodes respectively, indicating the presence of a peak in coherence between the internal and external signal around the expected (12 Hz) frequency.
3.6. Entrainer‐locked analysis
To visualize whether entrainment continued beyond the last entrainer and into the target period, we time‐locked the activity to the onset of the last entrainer (entrainer‐locked). Then, we estimated the ITC by separating the trials as a function of correct target‐present/target‐absent trials, using complex Morlet wavelets (Figure 4). The analysis of both Pz and Oz electrodes allowed us to confirm the effect of the 12 Hz entrainment throughout the entire entrainer period. Furthermore, this activity persisted after the entrainers and throughout the potential target window, which contained no entrainers, on both target‐present and, critically, on target‐absent trials. Therefore, even though no target stimulus appeared, neural activity continued to oscillate following the entrainment rhythm.
FIGURE 4.

Entrainer‐locked ITC graphs at 12 Hz obtained using complex Morlet wavelets. (a) Represents target‐present trials at Pz electrode. (b) Represents target‐absent trials at Pz electrode. (c) Represents target‐present trials at Oz electrode. (d) Represents target‐absent trials at Oz electrode. The time window for these graphs was −600 ms to 675 ms (no baseline). White, solid, vertical lines denote the last eight entrainers. Black, solid, vertical lines depict anti‐phase and in‐phase times (41.5, 83.3, 125, 166.6 ms after the last entrainer), whereas black, discontinuous, vertical lines represent one additional cycle of anti‐phase and in‐phase times (208.25 ms, 250 ms after the last entrainer) considered for the phase alignment analysis. Only correct trials were included and epochs were collapsed across relative phase and spatial validity. An increase of ITC around 12 Hz was clearly observed throughout the entrainer period and right through the target period. Separate topographical maps for target‐present (left) and target‐absent (right) trials of the ITC at 10–14 Hz are depicted. The time‐period used for these maps consists of the time from the onset of the last entrainer to the last possible time point at which the target could appear
3.7. 12 Hz phase at target onset on target‐present and target‐absent trials
To statistically corroborate the 12 Hz phase alignment with the expected anti‐phase and in‐phase onsets, we locked the EEG activity to the designated target‐present/target‐absent onset time for both Pz and Oz electrodes. As one of the primary objectives of this study was to focus on endogenous oscillations, above and beyond the target‐related ERPs (Samaha et al., 2015; van Diepen et al., 2015), the mean phases at in‐ and anti‐phase onsets were separately estimated for target‐present and target‐absent, correct trials, for all participants. Finally, the single‐trial phase for each time and condition was separately obtained for each participant and the angular difference (anti‐phase minus in‐phase) was calculated. If entrainment had an effect that lasted beyond the entrainer presentation, then a 180° phase separation at 12 Hz was expected between moment's anti‐phase and in‐phase with the preceding entrainers. With this in mind, we performed further statistical analyses first on target‐present trials, and next on target‐absent trials, which allowed us to avoid the effects of target‐related ERPs. We examined the phase difference between anti‐phase and in‐phase possible target moments on both target‐present and target‐absent trials (Figure 5), with the a‐priori hypothesis of 180° separation between the two. The results of the circular V‐test were statistically significant for target‐present and target‐absent conditions, on both Pz (target‐present: p = 1.12 × 10⁻⁵, target‐absent: p = 3.58 × 10⁻⁴) and Oz (target‐present: p = 6.26 × 10⁻⁶, target‐absent: p = 5.22 × 10⁻⁵) electrodes. This indicated that the angular differences between the phases of the 12 Hz spontaneous oscillation at anti‐phase versus in‐phase moment were not uniformly distributed: what is more, the mean angular difference was 180°, as anticipated by our hypothesis (see Table 1 for descriptive data).
FIGURE 5.

Schematic illustrations of the difference in activity on target‐locked trials. Analyses were performed separately, using correct trials only, for target‐present and target‐absent data. Phases were obtained using complex Morlet wavelets. (a) Represents target‐present trials at Pz electrode. (b) Represents target‐absent trials at Pz electrode. (c) Represents target‐present trials at Oz electrode. (d) Represents target‐absent trials at Oz electrode. In each representation, four graphs are depicted. On the top right, the graphs represent the broadband ERPs with its SEMs, time‐locked to target appearance (target‐present trials) or expected target appearance (target‐absent trials) (−200 ms to 250 ms, baseline: −200 ms to 0 ms). On the left, the circular graphs represent, for each participant (dots), the mean angular difference of the phase between in‐phase and anti‐phase trials. The length of the arrow is representative of the grand average of the mean differences. A clear 180° phase difference at 12 Hz between the phase of in‐phase (red) and anti‐phase (black) trials, with respect to the entrainers can be observed. Finally, the bottom rows show circular histograms where the bars represent the proportion of trials (pooled across all participants with no phase re‐alignment for the 20 possible phase bins) for anti‐phase (left) and in‐phase (right). Upon closer examination, an opposite phase preference for in‐phase and anti‐phase can be observed on both target‐present and target‐absent trials
TABLE 1.
Analysis of the circular separation (in‐phase – anti‐phase) for target‐present and target‐absent trials extracted with complex Morlet wavelets
| Electrode | Condition | Circular degrees (°) | Separation (in‐phase – anti‐phase) |
|---|---|---|---|
| Pz | Target‐present anti‐phase | 4.69° | 158.41° |
| Target‐present in‐phase | 163.1° | ||
| Target‐absent anti‐phase | 26.5° | 147.8° | |
| Target‐absent in‐phase | 174.3° | ||
| Oz | Target‐present anti‐phase | 18.52° | 151.28° |
| Target‐present in‐phase | 169.80° | ||
| Target‐absent anti‐phase | 17.27° | 162.13° | |
| Target‐absent in‐phase | 179.40° |
3.8. Phase alignment in the absence of external signal
A complementary analysis to corroborate that the experimental paradigm resulted in true neural entrainment, was to examine whether the endogenous oscillations maintained the entrained rhythm after the external stimulation ended and before relaxing back to their original eigenfrequency. In order to evaluate phase concentration at 12 Hz, we performed a Montecarlo procedure equivalent to the one described in the cue‐locked analysis, for the time‐period comprising 41.5 ms to 250 ms after the last entrainer. This time window encompassed three anti‐phase three in‐phase moments (the equivalent of two additional cycles beyond the first expected target appearance, or 3 cycles after the last entrainer). After multiple comparison correction (FDR), all p values were statistically significant, according to the predefined alpha significance value of p < 0.05 for all of the examined time points at both Pz and Oz electrodes. This result thus provided evidence for phase alignment of the internal oscillators with the external signal even 3 cycles after the external signal had been removed, a result that is consistent with the ITC and 12 Hz phase results above.
3.9. Control analyses
Several control analyses were performed using STFTs to replicate previous results but without the temporal smearing of evoked activity. (i) First, the analysis on last‐entrainer‐locked ITC data corroborated a significant phase concentration during the last eight entrainers (p < 0.05, FDR‐corrected) on both Pz and Oz electrodes. (ii) Second, the phase opposition results continued to indicate that the phase was not uniformly distributed at anti‐phase versus in‐phase moments and that the separation between both phases was the anticipated 180° in support of our hypothesis, for both target‐present (Pz: p = 1.15 × 10⁻³; Oz: p = 2.99 × 10⁻⁴) and target‐absent trials (Pz: p = 2.60 × 10⁻⁴; Oz: p = 3.65 × 10⁻⁵) (see Table 2).
TABLE 2.
Analysis of the circular separation (in‐phase – anti‐phase) for target‐present and target‐absent trials extracted with short time Fourier transforms
| Electrode | Condition | Circular degrees (°) | Separation (in‐phase – anti‐phase) |
|---|---|---|---|
| Pz | Target‐present anti‐phase | 18.34° | 171.60° |
| Target‐present in‐phase | 160.00° | ||
| Target‐absent anti‐phase | 21.91° | 163.93° | |
| Target‐absent in‐phase | 177.22° | ||
| Oz | Target‐present anti‐phase | 37.42° | 165.52° |
| Target‐present in‐phase | 153.75° | ||
| Target‐absent anti‐phase | 6.57° | 168.16° | |
| Target‐absent in‐phase | 169.02° |
Besides the phase alignment analyses, (iii) we carried out correlations, on target‐absent trials, between the 12 Hz phase just after the offset of the last entrainer (10 ms post‐onset) and the 12 Hz phase at the four temporal time points where targets should occur (anti‐phase 1, in‐phase 1, anti‐phase 2, in‐phase 2). A significant correlation at all time points (see Table 3), at both Pz and Oz electrodes, was found which, provided additional evidence for the presence of entrainment.
TABLE 3.
Circular correlations between the 12 Hz phase just after (10 ms) the offset of the last entrainer and on the temporal moment where targets should occur on target‐absent trials, separated as a function of the four possible times
| Last vs. Anti‐phase 1 | Last vs. In‐phase 1 | Last vs. Anti‐phase 2 | Last vs. In‐phase 2 | |
|---|---|---|---|---|
| Pz | p < 1.000 × 10−100 | p = 7.545 × 10−73 | p = 4.481 × 10⁻²⁶ | p = 6.470 × 10⁻¹⁰ |
| Oz | p < 1.000 × 10−100 | p = 6.727 × 10−61 | p = 6.989 × 10⁻¹⁴ | p = 2.816 × 10−08 |
Note: p values for both Pz and Oz electrodes are reported.
To assess the influence of 12 Hz phase on performance, (iv) we performed a circular correlation between the resulting phases (166 ms pre‐target onset, to avoid contamination from the target presentation) and RTs (for all four possible target onset times: anti‐phase 1, in‐phase 1, anti‐phase 2, and in‐phase 2), and a (v) phase opposition analysis as a function of response type (correct, incorrect) and type of target onset time (grouping the four onset times into two: anti‐phase, in‐phase). Interestingly, a significant correlation between 12 Hz phase and RTs was observed at in‐phase 1, at both Pz and Oz electrodes, but not at the other target onsets (see Table 4). Phase opposition analyses, however, were not significant between correct and incorrect trials (see Table 5).
TABLE 4.
Circular correlation between the 12 Hz phase, at 166 ms pre‐target onset and the reaction‐times for target‐present trials, separated as a function of the four possible target onset times
| Anti‐phase 1 | In‐phase 1 | Anti‐phase 2 | In‐phase 2 | |
|---|---|---|---|---|
| Pz | p = .595 | p = .049 | p = .656 | p = .608 |
| Oz | p = .948 | p = .008 | p = .855 | p = .699 |
Note: p values for both Pz and Oz electrodes are reported.
TABLE 5.
Phase (166 ms pre‐target) opposition between correct and incorrect trials, post‐last entrainer offset, collapsed as a function of type of target onset time
| Anti‐phase | In‐phase | |
|---|---|---|
| Pz | p = .979 | p = .976 |
| Oz | p = .955 | p = .999 |
Note: p values for both Pz and Oz electrodes are reported.
3.10. EEG alpha power lateralization
To ensure that the presence of the cue resulted in the expected inter‐hemispheric imbalance of alpha power typical of spatial attention orienting, we examined the lateralization of alpha oscillatory activity on correct trials (7–14 Hz) following the cue. For this analysis, power was obtained from cue‐locked data (0 ms to 1542 ms). The index of alpha power lateralization was assessed using the previously established time window (375 ms to 875 ms) and left ROI (P3, PO3, PO7, P7, P5, P1, PO9, and O1). A statistical analysis was performed comparing the inter‐subject average lateralization index (ipsi–contra), using a right‐tailed paired t test (see violin plot in Figure 6 for individual distribution). As expected, a significant alpha lateralization index was obtained, t(29) = 1.882, p = .035, d = .344, suggesting that participants were, in fact, effectively orienting spatial attention as a function of cue direction throughout the task (see Figure 6).
FIGURE 6.

(a) Representation of alpha (7–14 Hz) power lateralization from 0 ms to 1542 ms post‐cue (no baseline was used). Only correct trials were included in this analysis. The lateralization index was obtained by subtracting the previously obtained attended‐left average alpha power (ipsi left‐contra left) from the attended‐right average alpha power (ipsi right‐contra right) and dividing by the sum of the two. For the topographic plots, the average alpha power (7–14 Hz) for each electrode ipsilateral and contralateral to the cue on both left and right cue (attended‐left/attended‐right) trials was computed, at the time window 375 ms to 875 ms relative to cue onset (500 ms before the onset of the first entrainer). Please, note that we used the real activity for the left electrodes and the simulated activity for the right electrodes. Similarly, for the left cue, we used the real activity for the right electrodes, and the simulated for the left electrodes. (b) The bar graph represents the average power at 7–14 Hz, at the time window 375 ms to 875 ms relative to cue onset, for the electrodes contralateral (red) and ipsilateral (blue) to the cue on both left and right cue sides (attended‐left/attended‐right). (c) Finally, the lateralization index (explained above) for each participant was represented using a violin plot
4. DISCUSSION
The present study addressed neural entrainment using a set of predetermined requisites to establish its presence and tested whether it could occur under conditions of temporal task unpredictability. The answer to these issues could help to interpret previous entrainment results, understand the processes underlying entrainment, and provide insights on application in clinical contexts and other fields. Previous results, by Kizuk and Mathewson (2017) among others (Spaak et al., 2014; Wiesman & Wilson, 2019), provided evidence against the interpretation of entrainment as the mere succession of ERPs. However, additional proof is required to discard the alternative explanation that entrainment and its ensuing behavioral benefits are a side‐effect of ERPs related to expectancy and due to the inherent stimulus predictability built into the protocol (Breska & Deouell, 2016, 2017). Here, we introduced some modifications to the entrainment paradigm (Kizuk & Mathewson, 2017): [1] a stream of entrainers of variable, unpredictable length; [2] a detection task with bilateral targets; [3] an increased proportion of target‐absent trials, to which participants were instructed not to respond. These modifications reduced the predictability inherent to most entrainment paradigms and ensured a larger number of target‐absent trials to estimate interference‐free, post‐entrainer EEG activity. The main findings of this research study provide support for an adaptive mechanism based on endogenous oscillations capable of anticipating the temporal structure of external stimuli (Obleser & Kayser, 2019; Zoefel et al., 2018). More specifically, we found: [1] alignment of ongoing neural activity to the external rhythm and [2] persistence of phase alignment beyond the offset of the driving signal. However, [3] we found no behavioral benefits for targets aligned (in‐phase) with the entrainer rhythm. We discuss the implications of these findings, below.
First, we confirmed our initial prediction: an increase in the ITC at the entrained frequency was observed during the presentation of the external rhythm, together with a significant cross‐coherence between the neural activity and the entrainer. Specifically, after the phase reset produced by the first entrainer, the oscillatory activity remained aligned to the entrained frequency (12 Hz) throughout the entrainer stream. This is compatible with the hypothesis that the brain has a tendency to synchronize its endogenous oscillations to an external rhythm, in line with a number of other studies (Busch et al., 2009; Jones et al., 2002; Mathewson et al., 2010, 2012; Schroeder & Lakatos, 2009). Nevertheless, significant cross‐coherence is necessary but not sufficient to conclude that the alignment between the internal and external signals is a result of neural entrainment. To address this, we examined whether phase alignment persisted for a minimum of 2 cycles, post‐entrainer stream offset, which was our second prediction. We found that the alignment persisted for at least 3 cycles post‐entrainer and observed a clear‐cut 180° phase separation between out‐ and in‐phase moments, even for uncontaminated target‐absent trials. These results match those obtained by Kizuk and Mathewson (2017) and others, indicating the presence of oscillatory reverberation post‐entrainer offset (Helfrich et al., 2017, 2019). However, our study adds to these past findings by showing that this neural reverberation occurs despite the temporally unpredictable nature of the target appearance and the variable entrainer length. Again, this was witnessed on all trials, included the subset of trials uncontaminated by stimulus or response‐related activity within the post‐entrainer period. Furthermore, target‐absent trials as well as increased temporal unpredictability due to a variable number of entrainers and four different SOAs, allow us to remove the contamination of motor response‐related ERPs while also reducing the likelihood of the appearance of ERPs associated with expectation, which strengthens our support for the presence of neural entrainment (Breska & Deouell, 2016, 2017; Capilla et al., 2011; Herrmann & Johnsrude, 2018; Keitel et al., 2014; Zoefel et al., 2018).
These findings support the hypothesis that neural entrainment constitutes an anticipatory adaptive mechanism that may help sensory parsing via predictive processes (Helfrich et al., 2019; Henry et al., 2014). Furthermore, validating the requirements for neural entrainment has a relevant impact because of its potential for clinical use (Lakatos et al., 2019; Thaut et al., 2015). Neural entrainment may be used as a diagnostic tool, for example in psychiatric (e.g., schizophrenia; Lakatos et al., 2013) or pain disorders (Guo et al., 2020). It may also be useful as a therapeutic procedure, to improve coordination and oral‐motor synchronization in autism spectrum disorder (Bharathi et al., 2019) or stroke rehabilitation (Thaut & McIntosh, 2014). Further still, neural entrainment has been proposed to attenuate cognitive decline in Alzheimer's disease (Adaikkan & Tsai, 2020; Ferreira & Castellano, 2019; Iaccarino et al., 2016).
However, the results of this study failed to confirm our third prediction. We expected to obtain behavioral benefits for targets in‐phase with the driving frequency, based on results from the EEG and previous studies, such as Mathewson et al. (2012) and Kizuk and Mathewson (2017). To explain this null finding, we can start by focusing beyond the specific concept of entrainment on the literature related to alpha phase concentration. Despite some studies indicating a benefit of this phase concentration on detection or discrimination tasks (Busch et al., 2009; de Graaf et al., 2013; Kizuk & Mathewson, 2017; Lakatos et al., 2019; Mathewson et al., 2009), other studies did not confirm this benefit (Benwell et al., 2017; Bompas et al., 2015; Busch & VanRullen, 2010; Ruzzoli et al., 2019; Vigué‐Guix et al., 2020). Indeed, the accumulation of evidence seems to indicate that such phasic effects tend to be weak and highly dependent on experimental features, which remain to be clearly determined (e.g., Ruzzoli et al., 2019). With regard to neural entrainment of alpha phase, most studies showed benefits when targets were presented in‐phase compared to anti‐phase with the rhythmic entrainers and when phase was concentrated (de Graaf et al., 2013; Kizuk & Mathewson, 2017; Mathewson et al., 2012). On the other hand, in another neural entrainment study, despite observing an effect of alpha phase, the authors found an unexpected opposite effect on performance, with improved accuracy in anti‐phase (Spaak et al., 2014) as compared to in‐phase targets.
Furthermore, our study was methodologically quite similar to the Kizuk and Mathewson (2017) study, with the most notable difference being that our protocol reduced temporal predictability innate to previous entrainment paradigms by using a variable length of entrainers (8–12 entrainers). We do not believe that our results are in direct contradiction with previous studies, but we suggest that the net effect of rhythmic entrainment on behavior, particularly when other sources of anticipation are removed, may be weaker than previously thought. Therefore, the most plausible explanation so far is that, performance benefits observed in past studies may be a combination of neural entrainment, as demonstrated here, and other processes triggered by task predictability such as expectation (Helfrich et al., 2017) or memory‐based mechanisms (Breska & Deouell, 2017).
Future studies should extend the present results beyond the parameters used in both our study and the one by Kizuk and Mathewson (2017). Since the task focuses solely on one frequency and one cognitive function (visual attention), generalization to other stimulation frequencies, modalities, and cognitive processes should be investigated. But, other studies showing behavioral effects of entrainment at different oscillatory frequencies or cognitive processes such as visual discrimination (de Graaf et al., 2013), target detection (Mathewson et al., 2012), crossmodal illusory perception (Cecere et al., 2015), speech perception (Kösem et al., 2018), and source memory performance (Roberts et al., 2018), did not control for inherent task predictability. In our study, at the very least, we can claim that the putative effect of entrainment on performance, if any, must have been much smaller than the significant spatial attention effect, replicating the results of a myriad of past studies on discrimination accuracy (Carrasco, 2011; Carrasco et al., 2009; van Ede et al., 2012) and stimulus detection (Bergen & Julesz, 1983; Posner, 1980; Posner et al., 1980). Please note that this spatial attention effect was observed jointly with lateralization of alpha activity at posterior sites (Thut et al., 2006), supporting the hypothesis that alpha downregulates irrelevant information, in this case based on spatial location (Corbetta & Shulman, 2002; Hopfinger et al., 2000; Kastner et al., 1999; Kastner & Ungerleider, 2000). Finally, another aspect to take into account, is that we addressed the possible confound related to absolute expectation (one fixed timepoint) but did not modify the confounding factors related to “relative” expectation (a varying possible timepoint, with fixed spacing). We recommend that future studies examine the possible influence of relative expectation on entrainment, by adding jitter to the temporal timepoints at which targets can appear, as was done in Spaak et al. (2014).
Additionally, our analyses were initially focused on Pz electrode, similarly to past literature (e.g., Kizuk & Mathewson, 2017; Mathewson et al., 2009, 2012). However, after observing higher signal at the Oz electrode compared to Pz, we decided to run a series of exploratory analyses. We observed the same pattern of results in both electrodes, but with a greater effect in Oz. This result is in line with previous studies on visual stimulation and alpha oscillatory activity, which observed the peak of power activity (Alamia & VanRullen, 2019; Otero et al., 2020) and its highest signal to noise ratio at occipital sites (Ding et al., 2006; Srinivasan et al., 2006).
In conclusion, the results from the present study provide evidence for the neural entrainment hypothesis. Endogenous oscillations synchronize to external rhythms, and persist beyond these driving signals, forming a mechanistic basis for anticipatory parsing of the environment. Our study supported the hypothesis that neural entrainment most likely cannot be explained as a succession of ERPs. In addition, we have suggested that the net effect of this neural entrainment on overt behavior may be more limited than previously thought. It therefore remains to be tested whether and how this predictive mechanism modulates visual perception through the internal representation of the temporal properties of stimuli in a behaviorally relevant fashion. These results are important because they could clarify the processes underlying neural entrainment, which help interpret previous results, and provide insights on the application of these processes in clinical contexts and other fields.
AUTHOR CONTRIBUTIONS
Adrià Vilà‐Balló: Conceptualization; data curation; formal analysis; investigation; methodology; project administration; software; visualization; writing – original draft; writing – review and editing. Angela Marti‐Marca: Conceptualization; data curation; formal analysis; investigation; methodology; software; visualization; writing – original draft; writing – review and editing. Mireia Torralba Cuello: Conceptualization; data curation; formal analysis; methodology; software; writing – review and editing. Salvador Soto‐Faraco: Conceptualization; methodology; resources; supervision; writing – review and editing. Patricia Pozo‐Rosich: Conceptualization; funding acquisition; methodology; supervision; writing – review and editing.
CONFLICT OF INTEREST
The project leading to these results has received funding from “la Caixa” Foundation under the project code LCF/PR/PR16/51110005 and has been co‐funded with 50% by the European Regional Development Fund under the framework of the ERFD Operative Programme for Catalunya 2014–2020, with a grant of 1.527.637,88€. AVB is supported by the Spanish MICINN Juan de la Cierva postdoctoral grant (FJC2018‐036804‐I), and AMM by a predoctoral grant from the “Fundació Institut de Recerca Hospital Universitari Vall d'Hebron” (VHIR/BEQUESPREDOC/2020/MARTI). AVB and AMM have received a postdoctoral and a predoctoral contract respectively, from the “La Caixa” Foundation. SS‐F is supported by grants from the Ministerio de Ciencia e Innovación (PID2019‐108531GB‐I00 AEI/FEDER) and AGAUR Generalitat de Catalunya (2017 SGR 1545). PPR has received honoraria as a consultant and speaker for Allergan, Almirall, Biohaven, Chiesi, Eli Lilly, Medscape, Neurodiem, Novartis, and Teva. Her research group has received research grants from Allergan, AGAUR, la Caixa foundation, Migraine Research Foundation, Instituto Investigación Carlos III, MICINN, PERIS; and has received funding for clinical trials from Alder, Electrocore, Eli Lilly, Novartis, and Teva. She is a trustee member of the board of the International Headache Society and a member of the Council of the European Headache Federation. She is on the editorial board of Revista de Neurologia. She is an editor for Frontiers of Neurology and the Journal of Headache and Pain. She is a member of the Clinical Trials Guidelines Committee of the International Headache Society. She has edited the Guidelines for the Diagnosis and Treatment of Headache of the Spanish Neurological Society. She is the founder of www.midolordecabeza.org. PPR does not own stocks from any pharmaceutical company. Despite the above mentioned funding, the authors declare have no conflict of interest, financial or otherwise, related directly or indirectly to this work.
ACKNOWLEDGMENTS
The authors wish to extend a special thank you to all of the participants who collaborated in the present project. Open Access funding provided thanks to the CRUE‐CSIC agreement with Wiley.
Vilà‐Balló, A. , Marti‐Marca, A. , Torralba Cuello, M. , Soto‐Faraco, S. , & Pozo‐Rosich, P. (2022). The influence of temporal unpredictability on the electrophysiological mechanisms of neural entrainment. Psychophysiology, 59, e14108. 10.1111/psyp.14108
Adrià Vilà‐Balló and Angela Marti‐Marca contributed equally to this work.
REFERENCES
- Adaikkan, C. , & Tsai, L.‐H. (2020). Gamma entrainment: Impact on neurocircuits, glia, and therapeutic opportunities. Trends in Neurosciences, 43(1), 24–41. 10.1016/j.tins.2019.11.001 [DOI] [PubMed] [Google Scholar]
- Alamia, A. , & VanRullen, R. (2019). Alpha oscillations and traveling waves: Signatures of predictive coding? PLoS Biology, 17(10), e3000487. 10.1371/journal.pbio.3000487 [DOI] [PMC free article] [PubMed] [Google Scholar]
- Aydore, S. , Pantazis, D. , & Leahy, R. M. (2013). A note on the phase locking value and its properties. NeuroImage, 74, 231–244. 10.1016/j.neuroimage.2013.02.008 [DOI] [PMC free article] [PubMed] [Google Scholar]
- Azzopardi, P. , & Cowey, A. (1998). Blindsight and visual awareness. Consciousness and Cognition, 7, 292–311. 10.1006/ccog.1998.0358 [DOI] [PubMed] [Google Scholar]
- Beck, A. , Steer, R. , & Brown, G. (Eds.). (1996). Manual for the Beck Depression Inventory‐II. Psychological Corporation. [Google Scholar]
- Benjamini, Y. , Drai, D. , Elmer, G. , Kafkafi, N. , & Golani, I. (2001). Controlling the false discovery rate in behavior genetics research. Behavioural Brain Research, 125(1–2), 279–284. 10.1016/s0166-4328(01)00297-2 [DOI] [PubMed] [Google Scholar]
- Benwell, C. S. Y. , Tagliabue, C. F. , Veniero, D. , Cecere, R. , Savazzi, S. , & Thut, G. (2017). Prestimulus EEG power predicts conscious awareness but not objective visual performance. ENeuro, 4(6), ENEURO.0182–ENEU17.2017. 10.1523/ENEURO.0182-17.2017 [DOI] [PMC free article] [PubMed] [Google Scholar]
- Berens, P. (2009). CircStat: A MATLAB toolbox for circular statistics. Journal of Statistical Software, 31(1), 1–21. 10.18637/jss.v031.i10 [DOI] [Google Scholar]
- Bergen, J. R. , & Julesz, B. (1983). Parallel versus serial processing in rapid pattern discrimination. Nature, 303(5919), 696–698. 10.1038/303696a0 [DOI] [PubMed] [Google Scholar]
- Bharathi, G. , Jayaramayya, K. , Balasubramanian, V. , & Vellingiri, B. (2019). The potential role of rhythmic entrainment and music therapy intervention for individuals with autism spectrum disorders. Journal of Exercise Rehabilitation, 15(2), 180–186. 10.12965/jer.1836578.289 [DOI] [PMC free article] [PubMed] [Google Scholar]
- Biltoft, C. A. , & Pardyjak, E. R. (2009). Spectral coherence and the statistical significance of turbulent flux computations. Journal of Atmospheric and Oceanic Technology, 26(2), 403–409. 10.1175/2008JTECHA1141.1 [DOI] [Google Scholar]
- Bompas, A. , Sumner, P. , Muthumumaraswamy, S. D. , Singh, K. D. , & Gilchrist, I. D. (2015). The contribution of pre‐stimulus neural oscillatory activity to spontaneous response time variability. NeuroImage, 107, 34–45. 10.1016/j.neuroimage.2014.11.057 [DOI] [PMC free article] [PubMed] [Google Scholar]
- Brainard, D. H. (1997). The psychophysics toolbox. Spatial Vision, 10(4), 433–436. 10.1163/156856897X00357 [DOI] [PubMed] [Google Scholar]
- Breska, A. , & Deouell, L. Y. (2016). When synchronizing to rhythms is not a good thing: Modulations of preparatory and post‐target neural activity when shifting attention away from on‐beat times of a distracting rhythm. The Journal of Neuroscience: The Official Journal of the Society for Neuroscience, 36(27), 7154–7166. 10.1523/JNEUROSCI.4619-15.2016 [DOI] [PMC free article] [PubMed] [Google Scholar]
- Breska, A. , & Deouell, L. Y. (2017). Neural mechanisms of rhythm‐based temporal prediction: Delta phase‐locking reflects temporal predictability but not rhythmic entrainment. PLoS Biology, 15(2), e2001665. 10.1371/journal.pbio.2001665 [DOI] [PMC free article] [PubMed] [Google Scholar]
- Busch, N. A. , Dubois, J. , & VanRullen, R. (2009). The phase of ongoing EEG oscillations predicts visual perception. Journal of Neuroscience, 29(24), 7869–7876. 10.1523/JNEUROSCI.0113-09.2009 [DOI] [PMC free article] [PubMed] [Google Scholar]
- Busch, N. A. , & VanRullen, R. (2010). Spontaneous EEG oscillations reveal periodic sampling of visual attention. Proceedings of the National Academy of Sciences of the United States of America, 107(37), 16048–16053. 10.1073/pnas.1004801107 [DOI] [PMC free article] [PubMed] [Google Scholar]
- Capilla, A. , Pazo‐Alvarez, P. , Darriba, A. , Campo, P. , & Gross, J. (2011). Steady‐state visual evoked potentials can be explained by temporal superposition of transient event‐related responses. PLoS One, 6(1), e14543. 10.1371/journal.pone.0014543 [DOI] [PMC free article] [PubMed] [Google Scholar]
- Carrasco, M. (2011). Visual attention: The past 25 years. Vision Research, 51(13), 1484–1525. 10.1016/j.visres.2011.04.012 [DOI] [PMC free article] [PubMed] [Google Scholar]
- Carrasco, M. , Eckstein, M. , Verghese, P. , Boynton, G. , & Treue, S. (2009). Visual attention: Neurophysiology, psychophysics and cognitive neuroscience. Vision Research, 49(10), 1033–1036. 10.1016/j.visres.2009.04.022 [DOI] [PubMed] [Google Scholar]
- Cecere, R. , Rees, G. , & Romei, V. (2015). Individual differences in alpha frequency drive crossmodal illusory perception. Current Biology: CB, 25(2), 231–235. 10.1016/j.cub.2014.11.034 [DOI] [PMC free article] [PubMed] [Google Scholar]
- Cohen, J. (1992). A power primer. Psychological Bulletin, 112(1), 155–159. 10.1037/0033-2909.112.1.155 [DOI] [PubMed] [Google Scholar]
- Cohen, M. X. (2015). Effects of time lag and frequency matching on phase‐based connectivity. Journal of Neuroscience Methods, 250, 137–146. 10.1016/j.jneumeth.2014.09.005 [DOI] [PubMed] [Google Scholar]
- Corbetta, M. , & Shulman, G. L. (2002). Control of goal‐directed and stimulus‐driven attention in the brain. Nature Reviews. Neuroscience, 3(3), 201–215. 10.1038/nrn755 [DOI] [PubMed] [Google Scholar]
- de Graaf, T. A. , Gross, J. , Paterson, G. , Rusch, T. , Sack, A. T. , & Thut, G. (2013). Alpha‐band rhythms in visual task performance: Phase‐locking by rhythmic sensory stimulation. PLoS One, 8(3), e60035. 10.1371/journal.pone.0060035 [DOI] [PMC free article] [PubMed] [Google Scholar]
- Delorme, A. , & Makeig, S. (2004). EEGLAB: An open source toolbox for analysis of single‐trial EEG dynamics including independent component analysis. Journal of Neuroscience Methods, 134(1), 9–21. 10.1016/j.jneumeth.2003.10.009 [DOI] [PubMed] [Google Scholar]
- Ding, J. , Sperling, G. , & Srinivasan, R. (2006). Attentional modulation of SSVEP power depends on the network tagged by the flicker frequency. Cerebral Cortex, 16(7), 1016–1029. 10.1093/cercor/bhj044 [DOI] [PMC free article] [PubMed] [Google Scholar]
- Durand, D. , & Greenwood, J. A. (1958). Modifications of the rayleigh test for uniformity in analysis of two‐dimensional orientation data. The Journal of Geology, 66(3), 229–238. 10.1086/626501 [DOI] [Google Scholar]
- Ernst, M. (2004). Permutation methods: A basis for exact inference. Statistical Science, 19, 676–685. 10.1214/088342304000000396 [DOI] [Google Scholar]
- Ferreira, A. C. , & Castellano, J. M. (2019). Leaving the lights on using gamma entrainment to protect against neurodegeneration. Neuron, 102(5), 901–902. 10.1016/j.neuron.2019.05.020 [DOI] [PubMed] [Google Scholar]
- Fisher, R. A. (1925). Statistical Methods for Research Workers. Oliver and Boyd. [Google Scholar]
- Guo, Y. , Bufacchi, R. J. , Novembre, G. , Kilintari, M. , Moayedi, M. , Hu, L. , & Iannetti, G. D. (2020). Ultralow‐frequency neural entrainment to pain. PLoS Biology, 18(4), e3000491. 10.1371/journal.pbio.3000491 [DOI] [PMC free article] [PubMed] [Google Scholar]
- Haegens, S. , Cousijn, H. , Wallis, G. , Harrison, P. J. , & Nobre, A. C. (2014). Inter‐ and intra‐individual variability in alpha peak frequency. NeuroImage, 92(100), 46–55. 10.1016/j.neuroimage.2014.01.049 [DOI] [PMC free article] [PubMed] [Google Scholar]
- Haegens, S. , & Zion Golumbic, E. (2018). Rhythmic facilitation of sensory processing: A critical review. Neuroscience and Biobehavioral Reviews, 86, 150–165. 10.1016/j.neubiorev.2017.12.002 [DOI] [PubMed] [Google Scholar]
- Helfrich, R. F. , Breska, A. , & Knight, R. T. (2019). Neural entrainment and network resonance in support of top‐down guided attention. Current Opinion in Psychology, 29, 82–89. 10.1016/j.copsyc.2018.12.016 [DOI] [PMC free article] [PubMed] [Google Scholar]
- Helfrich, R. F. , Huang, M. , Wilson, G. , & Knight, R. T. (2017). Prefrontal cortex modulates posterior alpha oscillations during top‐down guided visual perception. Proceedings of the National Academy of Sciences of the United States of America, 114(35), 9457–9462. 10.1073/pnas.1705965114 [DOI] [PMC free article] [PubMed] [Google Scholar]
- Henry, M. J. , Herrmann, B. , & Obleser, J. (2014). Entrained neural oscillations in multiple frequency bands comodulate behavior. Proceedings of the National Academy of Sciences of the United States of America, 111(41), 14935–14940. 10.1073/pnas.1408741111 [DOI] [PMC free article] [PubMed] [Google Scholar]
- Herrmann, B. , & Johnsrude, I. S. (2018). Neural signatures of the processing of temporal patterns in sound. The Journal of Neuroscience: The Official Journal of the Society for Neuroscience, 38(24), 5466–5477. 10.1523/JNEUROSCI.0346-18.2018 [DOI] [PMC free article] [PubMed] [Google Scholar]
- Hopfinger, J. B. , Buonocore, M. H. , & Mangun, G. R. (2000). The neural mechanisms of top‐down attentional control. Nature Neuroscience, 3(3), 284–291. 10.1038/72999 [DOI] [PubMed] [Google Scholar]
- Iaccarino, H. F. , Singer, A. C. , Martorell, A. J. , Rudenko, A. , Gao, F. , Gillingham, T. Z. , Mathys, H. , Seo, J. , Kritskiy, O. , Abdurrob, F. , Adaikkan, C. , Canter, R. G. , Rueda, R. , Brown, E. N. , Boyden, E. S. , & Tsai, L.‐H. (2016). Gamma frequency entrainment attenuates amyloid load and modifies microglia. Nature, 540(7632), 230–235. 10.1038/nature20587 [DOI] [PMC free article] [PubMed] [Google Scholar]
- Jennings, J. R. , & Wood, C. C. (1976). Letter: The epsilon‐adjustment procedure for repeated‐measures analyses of variance. Psychophysiology, 13(3), 277–278. 10.1111/j.1469-8986.1976.tb00116.x [DOI] [PubMed] [Google Scholar]
- Jones, M. R. , Moynihan, H. , MacKenzie, N. , & Puente, J. (2002). Temporal aspects of stimulus‐driven attending in dynamic arrays. Psychological Science, 13(4), 313–319. 10.1111/1467-9280.00458 [DOI] [PubMed] [Google Scholar]
- Kaernbach, C. (1990). A single‐interval adjustment‐matrix (SIAM) procedure for unbiased adaptive testing. The Journal of the Acoustical Society of America, 88(6), 2645–2655. 10.1121/1.399985 [DOI] [PubMed] [Google Scholar]
- Kastner, S. , Pinsk, M. A. , De Weerd, P. , Desimone, R. , & Ungerleider, L. G. (1999). Increased activity in human visual cortex during directed attention in the absence of visual stimulation. Neuron, 22(4), 751–761. 10.1016/s0896-6273(00)80734-5 [DOI] [PubMed] [Google Scholar]
- Kastner, S. , & Ungerleider, L. G. (2000). Mechanisms of visual attention in the human cortex. Annual Review of Neuroscience, 23, 315–341. 10.1146/annurev.neuro.23.1.315 [DOI] [PubMed] [Google Scholar]
- Keitel, C. , Quigley, C. , & Ruhnau, P. (2014). Stimulus‐driven brain oscillations in the alpha range: Entrainment of intrinsic rhythms or frequency‐following response? The Journal of Neuroscience, 34(31), 10137–10140. 10.1523/JNEUROSCI.1904-14.2014 [DOI] [PMC free article] [PubMed] [Google Scholar]
- Keitel, C. , Thut, G. , & Gross, J. (2017). Visual cortex responses reflect temporal structure of continuous quasi‐rhythmic sensory stimulation. NeuroImage, 146, 58–70. 10.1016/j.neuroimage.2016.11.043 [DOI] [PMC free article] [PubMed] [Google Scholar]
- Kessler, R. C. , Adler, L. , Ames, M. , Demler, O. , Faraone, S. , Hiripi, E. , Howes, M. J. , Jin, R. , Secnik, K. , Spencer, T. , Ustun, T. B. , & Walters, E. E. (2005). The World Health Organization Adult ADHD Self‐Report Scale (ASRS): A short screening scale for use in the general population. Psychological Medicine, 35(2), 245–256. 10.1017/s0033291704002892 [DOI] [PubMed] [Google Scholar]
- Kizuk, S. A. D. , & Mathewson, K. E. (2017). Power and phase of alpha oscillations reveal an interaction between spatial and temporal visual attention. Journal of Cognitive Neuroscience, 29(3), 480–494. 10.1162/jocn_a_01058 [DOI] [PubMed] [Google Scholar]
- Kleiner, M. , Brainard, D. H. , Pelli, D. , Ingling, A. , Murray, R. , & Broussard, C. (2007). What's new in psychtoolbox‐3. Perception, 36, 1–16. 10.1068/v070821 [DOI] [Google Scholar]
- Kösem, A. , Bosker, H. R. , Takashima, A. , Meyer, A. , Jensen, O. , & Hagoort, P. (2018). Neural entrainment determines the words we hear. Current Biology: CB, 28(18), 2867–2875.e3. 10.1016/j.cub.2018.07.023 [DOI] [PubMed] [Google Scholar]
- Lakatos, P. , Gross, J. , & Thut, G. (2019). A new unifying account of the roles of neuronal entrainment. Current Biology: CB, 29(18), R890–R905. 10.1016/j.cub.2019.07.075 [DOI] [PMC free article] [PubMed] [Google Scholar]
- Lakatos, P. , Schroeder, C. E. , Leitman, D. I. , & Javitt, D. C. (2013). Predictive suppression of cortical excitability and its deficit in schizophrenia. The Journal of Neuroscience, 33(28), 11692–11702. 10.1523/JNEUROSCI.0010-13.2013 [DOI] [PMC free article] [PubMed] [Google Scholar]
- Large, E. W. , & Jones, M. R. (1999). The dynamics of attending: How people track time‐varying events. Psychological Review, 106(1), 119–159. 10.1037/0033-295X.106.1.119 [DOI] [Google Scholar]
- Lopez‐Calderon, J. , & Luck, S. J. (2014). ERPLAB: An open‐source toolbox for the analysis of event‐related potentials. Frontiers in Human Neuroscience, 8, 213. 10.3389/fnhum.2014.00213 [DOI] [PMC free article] [PubMed] [Google Scholar]
- Maris, E. , & Oostenveld, R. (2007). Nonparametric statistical testing of EEG‐ and MEG‐data. Journal of Neuroscience Methods, 164(1), 177–190. 10.1016/j.jneumeth.2007.03.024 [DOI] [PubMed] [Google Scholar]
- Mathewson, K. E. , Fabiani, M. , Gratton, G. , Beck, D. M. , & Lleras, A. (2010). Rescuing stimuli from invisibility: Inducing a momentary release from visual masking with pre‐target entrainment. Cognition, 115(1), 186–191. 10.1016/j.cognition.2009.11.010 [DOI] [PubMed] [Google Scholar]
- Mathewson, K. E. , Gratton, G. , Fabiani, M. , Beck, D. M. , & Ro, T. (2009). To see or not to see: Prestimulus alpha phase predicts visual awareness. The Journal of Neuroscience: The Official Journal of the Society for Neuroscience, 29(9), 2725–2732. 10.1523/JNEUROSCI.3963-08.2009 [DOI] [PMC free article] [PubMed] [Google Scholar]
- Mathewson, K. E. , Prudhomme, C. , Fabiani, M. , Beck, D. M. , Lleras, A. , & Gratton, G. (2012). Making waves in the stream of consciousness: Entraining oscillations in EEG alpha and fluctuations in visual awareness with rhythmic visual stimulation. Journal of Cognitive Neuroscience, 24(12), 2321–2333. 10.1162/jocn_a_00288 [DOI] [PubMed] [Google Scholar]
- Morey, R. D. , Rouder, J. N. , Jamil, T. , & Morey, M. R. D. (2017, December 13). Package ‘bayesfactor’. The Comprehensive R Archive Network (CRAN). https://cran.r‐project.org/web/packages/BayesFactor/BayesFactor.pdf [Google Scholar]
- Obleser, J. , & Kayser, C. (2019). Neural entrainment and attentional selection in the listening brain. Trends in Cognitive Sciences, 23(11), 913–926. 10.1016/j.tics.2019.08.004 [DOI] [PubMed] [Google Scholar]
- Oostenveld, R. , Fries, P. , Maris, E. , & Schoffelen, J. M. (2011). FieldTrip: Open source software for advanced analysis of MEG, EEG, and invasive electrophysiological data. Computational Intelligence and Neuroscience, 2011, 156869. 10.1155/2011/156869 [DOI] [PMC free article] [PubMed] [Google Scholar]
- Otero, M. , Prado‐Gutiérrez, P. , Weinstein, A. , Escobar, M.‐J. , & El‐Deredy, W. (2020). Persistence of EEG alpha entrainment depends on stimulus phase at offset. Frontiers in Human Neuroscience, 14, 139. 10.3389/fnhum.2020.00139 [DOI] [PMC free article] [PubMed] [Google Scholar]
- Pasquereau, B. , & Turner, R. S. (2015). Dopamine neurons encode errors in predicting movement trigger occurrence. Journal of Neurophysiology, 113(4), 1110–1123. 10.1152/jn.00401.2014 [DOI] [PMC free article] [PubMed] [Google Scholar]
- Posner, M. I. (1980). Orienting of attention. The Quarterly Journal of Experimental Psychology, 32(1), 3–25. 10.1080/00335558008248231 [DOI] [PubMed] [Google Scholar]
- Posner, M. I. , Snyder, C. R. , & Davidson, B. J. (1980). Attention and the detection of signals. Journal of Experimental Psychology, 109(2), 160–174. 10.1037/0096-3445.109.2.160 [DOI] [PubMed] [Google Scholar]
- Roberts, B. M. , Clarke, A. , Addante, R. J. , & Ranganath, C. (2018). Entrainment enhances theta oscillations and improves episodic memory. Cognitive Neuroscience, 9(3–4), 181–193. 10.1080/17588928.2018.1521386 [DOI] [PubMed] [Google Scholar]
- Ruzzoli, M. , Torralba, M. , Morís Fernández, L. , & Soto‐Faraco, S. (2019). The relevance of alpha phase in human perception. Cortex; a Journal Devoted to the Study of the Nervous System and Behavior, 120, 249–268. 10.1016/j.cortex.2019.05.012 [DOI] [PubMed] [Google Scholar]
- Samaha, J. , Bauer, P. , Cimaroli, S. , & Postle, B. R. (2015). Top‐down control of the phase of alpha‐band oscillations as a mechanism for temporal prediction. Proceedings of the National Academy of Sciences of the United States of America, 112(27), 8439–8444. 10.1073/pnas.1503686112 [DOI] [PMC free article] [PubMed] [Google Scholar]
- Schroeder, C. E. , & Lakatos, P. (2009). Low‐frequency neuronal oscillations as instruments of sensory selection. Trends in Neurosciences, 32(1), 9–18. 10.1016/j.tins.2008.09.012 [DOI] [PMC free article] [PubMed] [Google Scholar]
- Spaak, E. , de Lange, F. P. , & Jensen, O. (2014). Local entrainment of α oscillations by visual stimuli causes cyclic modulation of perception. The Journal of Neuroscience: The Official Journal of the Society for Neuroscience, 34(10), 3536–3544. 10.1523/JNEUROSCI.4385-13.2014 [DOI] [PMC free article] [PubMed] [Google Scholar]
- Srinivasan, R. , Bibi, F. A. , & Nunez, P. L. (2006). Steady‐state visual evoked potentials: Distributed local sources and wave‐like dynamics are sensitive to flicker frequency. Brain Topography, 18(3), 167–187. 10.1007/s10548-006-0267-4 [DOI] [PMC free article] [PubMed] [Google Scholar]
- ten Oever, S. , Schroeder, C. E. , Poeppel, D. , van Atteveldt, N. , & Zion‐Golumbic, E. (2014). Rhythmicity and cross‐modal temporal cues facilitate detection. Neuropsychologia, 63, 43–50. 10.1016/j.neuropsychologia.2014.08.008 [DOI] [PMC free article] [PubMed] [Google Scholar]
- Thaut, M. H. , & McIntosh, G. C. (2014). Neurologic music therapy in stroke rehabilitation. Current Physical Medicine and Rehabilitation Reports, 2(2), 106–113. 10.1007/s40141-014-0049-y [DOI] [Google Scholar]
- Thaut, M. H. , McIntosh, G. C. , & Hoemberg, V. (2015). Neurobiological foundations of neurologic music therapy: Rhythmic entrainment and the motor system. Frontiers in Psychology, 5, 1185. 10.3389/fpsyg.2014.01185 [DOI] [PMC free article] [PubMed] [Google Scholar]
- Thut, G. , Nietzel, A. , Brandt, S. A. , & Pascual‐Leone, A. (2006). Alpha‐band electroencephalographic activity over occipital cortex indexes visuospatial attention bias and predicts visual target detection. The Journal of Neuroscience: The Official Journal of the Society for Neuroscience, 26(37), 9494–9502. 10.1523/JNEUROSCI.0875-06.2006 [DOI] [PMC free article] [PubMed] [Google Scholar]
- Thut, G. , Schyns, P. G. , & Gross, J. (2011). Entrainment of perceptually relevant brain oscillations by non‐invasive rhythmic stimulation of the human brain. Frontiers in Psychology, 2, 170. 10.3389/fpsyg.2011.00170 [DOI] [PMC free article] [PubMed] [Google Scholar]
- Torralba Cuello, M. , Drew, A. , Sabaté San José, A. , Morís Fernández, L. , & Soto‐Faraco, S. (2022). Alpha fluctuations regulate the accrual of visual information to awareness. Cortex; a Journal Devoted to the Study of the Nervous System and Behavior, 147, 58–71. 10.1016/j.cortex.2021.11.017 [DOI] [PubMed] [Google Scholar]
- van Diepen, R. M. , Cohen, M. X. , Denys, D. , & Mazaheri, A. (2015). Attention and temporal expectations modulate power, not phase, of ongoing alpha oscillations. Journal of Cognitive Neuroscience, 27(8), 1573–1586. 10.1162/jocn_a_00803 [DOI] [PubMed] [Google Scholar]
- van Ede, F. , de Lange, F. P. , & Maris, E. (2012). Attentional cues affect accuracy and reaction time via different cognitive and neural processes. Journal of Neuroscience, 32(30), 10408–10412. 10.1523/JNEUROSCI.1337-12.2012 [DOI] [PMC free article] [PubMed] [Google Scholar]
- Vigué‐Guix, I. , Morís Fernández, L. , Torralba Cuello, M. , Ruzzoli, M. , & Soto‐Faraco, S. (2020). Can the occipital alpha‐phase speed up visual detection through a real‐time EEG‐based brain‐computer interface (BCI)? The European Journal of Neuroscience. 10.1111/ejn.14931 [DOI] [PubMed] [Google Scholar]
- Wagenmakers, E.‐J. , Love, J. , Marsman, M. , Jamil, T. , Ly, A. , Verhagen, J. , Selker, R. , Gronau, Q. F. , Dropmann, D. , Boutin, B. , Meerhoff, F. , Knight, P. , Raj, A. , van Kesteren, E.‐J. , van Doorn, J. , Šmíra, M. , Epskamp, S. , Etz, A. , Matzke, D. , … Morey, R. D. (2018). Bayesian inference for psychology. Part II: Example applications with JASP. Psychonomic Bulletin & Review, 25(1), 58–76. 10.3758/s13423-017-1323-7 [DOI] [PMC free article] [PubMed] [Google Scholar]
- Wagenmakers, E.‐J. , Marsman, M. , Jamil, T. , Ly, A. , Verhagen, J. , Love, J. , Selker, R. , Gronau, Q. F. , Šmíra, M. , Epskamp, S. , Matzke, D. , Rouder, J. N. , & Morey, R. D. (2018). Bayesian inference for psychology. Part I: Theoretical advantages and practical ramifications. Psychonomic Bulletin & Review, 25(1), 35–57. 10.3758/s13423-017-1343-3 [DOI] [PMC free article] [PubMed] [Google Scholar]
- Wiesman, A. I. , & Wilson, T. W. (2019). Alpha frequency entrainment reduces the effect of visual distractors. Journal of Cognitive Neuroscience, 31(9), 1392–1403. 10.1162/jocn_a_01422 [DOI] [PMC free article] [PubMed] [Google Scholar]
- Worden, M. S. , Foxe, J. J. , Wang, N. , & Simpson, G. V. (2000). Anticipatory biasing of visuospatial attention indexed by retinotopically specific alpha‐band electroencephalography increases over occipital cortex. The Journal of Neuroscience: The Official Journal of the Society for Neuroscience, 20(6), RC63. 10.1523/jneurosci.20-06-j0002.2000 [DOI] [PMC free article] [PubMed] [Google Scholar]
- Zoefel, B. , Ten Oever, S. , & Sack, A. T. (2018). The involvement of endogenous neural oscillations in the processing of rhythmic input: More than a regular repetition of evoked neural responses. Frontiers in Neuroscience, 12, 95. 10.3389/fnins.2018.00095 [DOI] [PMC free article] [PubMed] [Google Scholar]