
FIGURE 3.
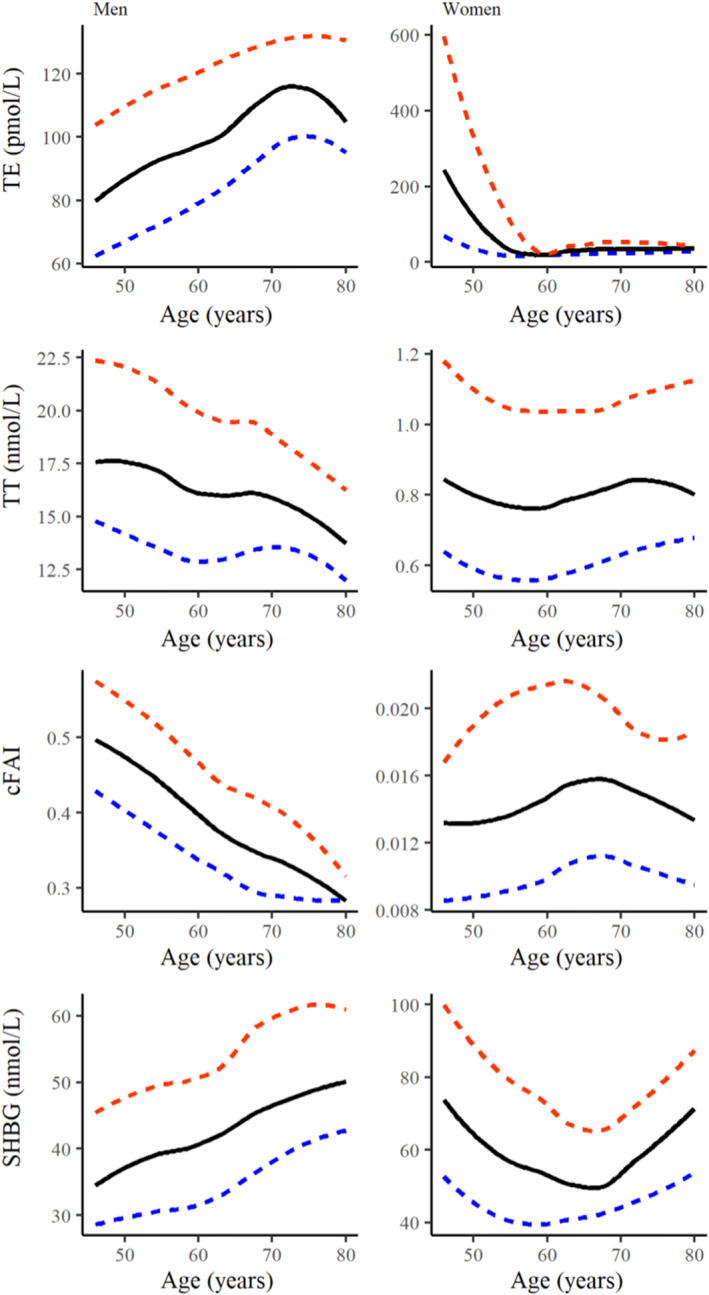
Levels of total estradiol, total testosterone, cFAI and SHBG across age. Smoothed percentile plots of total estradiol, total testosterone, cFAI, and SHBG for each age‐year in 1490 men (left) and 1801 women (right). The median is a solid line, 25th and 75th percentile are depicted as dashed lines. cFAI, calculated free androgen index; SHBG, sex steroid‐binding globulin; TE, total estradiol; TT, total testosterone.