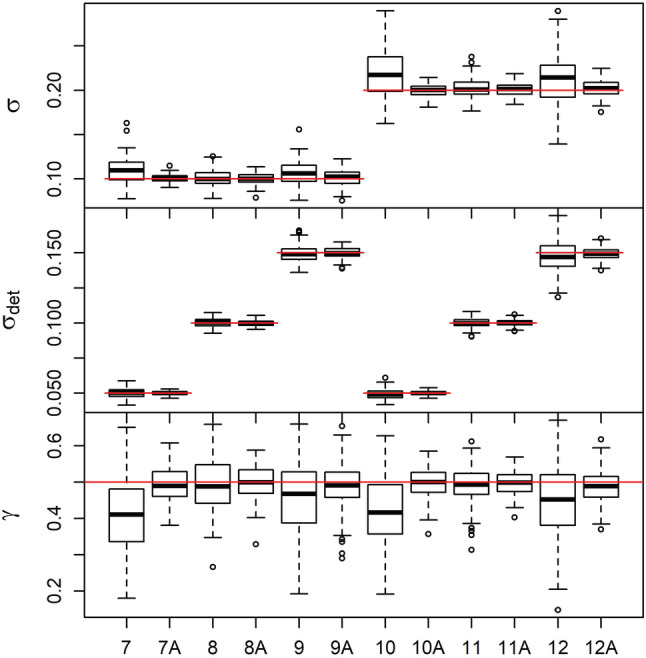
FIGURE 4.

Boxplots of parameter estimates under the correlated random walk model without telemetry data (Scenarios 7–12) and with telemetry data (Scenarios 7A–12A). The top panel shows σ, the middle panel shows σdet, and the bottom panel shows γ. Scenario 7: σ = 0.1 and σdet = 0.05, Scenario 8: σ = 0.1 and σdet = 0.1, Scenario 9: σ = 0.1 and σdet = 0.15, Scenario 10: σ = 0.2 and σdet = 0.05, Scenario 11: σ = 0.2 and σdet = 0.1, Scenario 12: σ = 0.2 and σdet = 0.15. For all scenarios, γ = 0.5. Red lines indicate the true value for each scenario.
