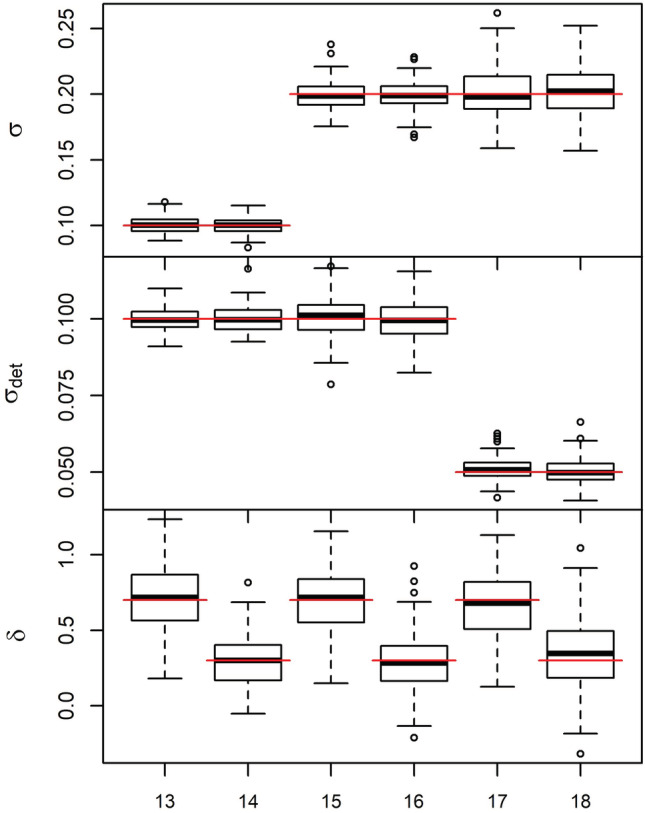
FIGURE 5.

Boxplots of parameter estimates under the integrated Langevin model (Scenarios 13–18). The top panel shows σ, the middle panel shows σdet, and the bottom panel shows δ. Scenario 13: σ = 0.1, σdet = 0.1, and δ = 0.7, Scenario 14: σ = 0.1, σdet = 0.1, and δ = 0.3, Scenario 15: σ = 0.2, σdet = 0.1, and δ = 0.7, Scenario 16: σ = 0.2, σdet = 0.1, and δ = 0.3, Scenario 17: σ = 0.2,σdet = 0.05, and δ = 0.7, Scenario 18: σ = 0.2, σdet = 0.05, and δ = 0.3. Red lines indicate the true value for each scenario.
