Figure 4.

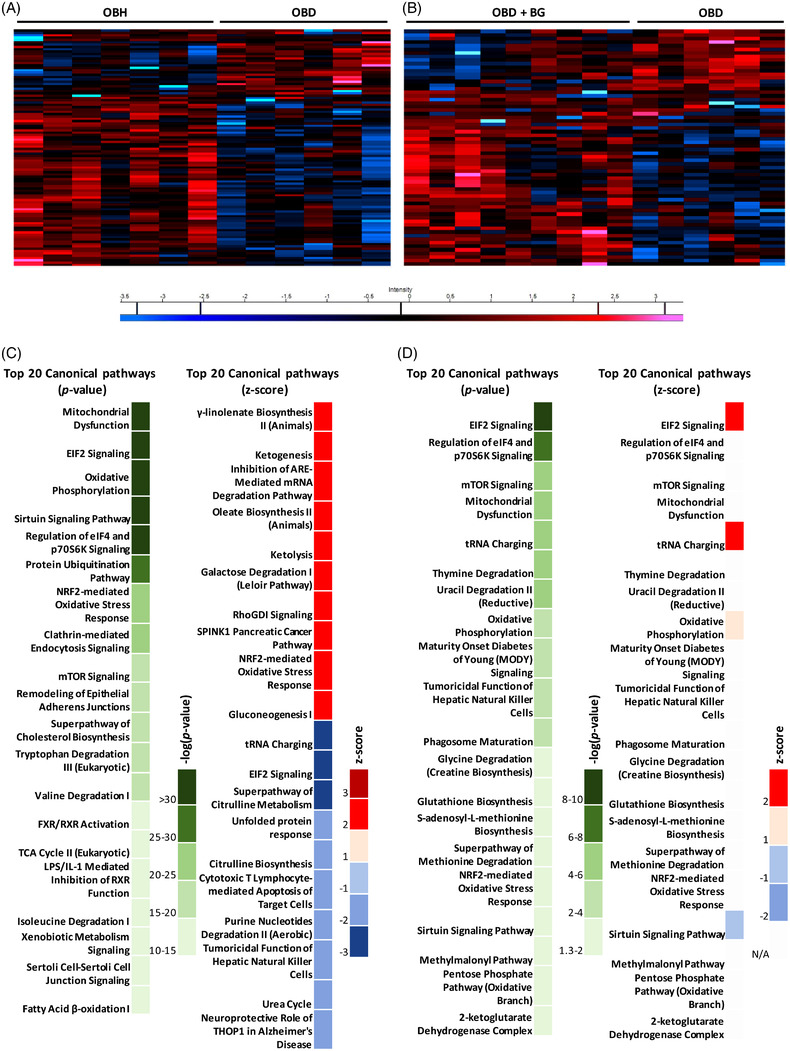
Microbiome and β‐glucan alter hepatic protein signatures. A) OBH and OBD hepatic proteomic signature heat map. B) OBD and OBD+β‐glucan (BG) hepatic proteomic signature heat map. Red and blue bars indicate proteins significantly up or down regulated respectively (p ≤ 0.05). Canonical pathway analysis of differentially expressed hepatic protein using IPA. C) Top 20 canonical pathways as per −log(p‐value) and as per z‐score in OBD with respect to OBH. D) Top 20 canonical pathways as per −log(p‐value) and as per z‐score in OBD+β‐glucan with respect to OBD.
