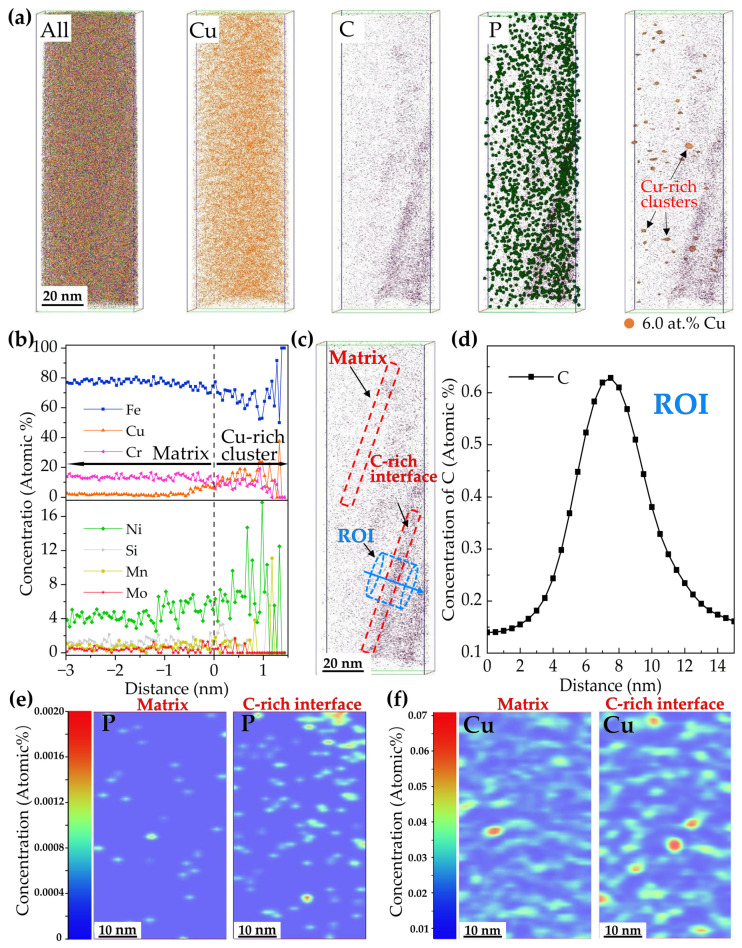
Figure 7.
(a) The three dimensional (3-D) atomic probe maps and 3-D reconstructions based on isoconcentration surfaces of 6.0 at.% Cu in the 3Cu-steel tempered at 450 °C. (b) Proximity histograms of the Cu-rich clusters displayed in (a). (c) The 3-D atomic probe map of the C atoms and the region of interest (ROI), (d) a 1-D concentration profile of the ROI displayed by the light blue cylinder in (c). The 2-D concentration mappings of P (e) and Cu (f) taken from the “matrix” and “C-rich interface” regions are displayed by the red rectangles in (c).

