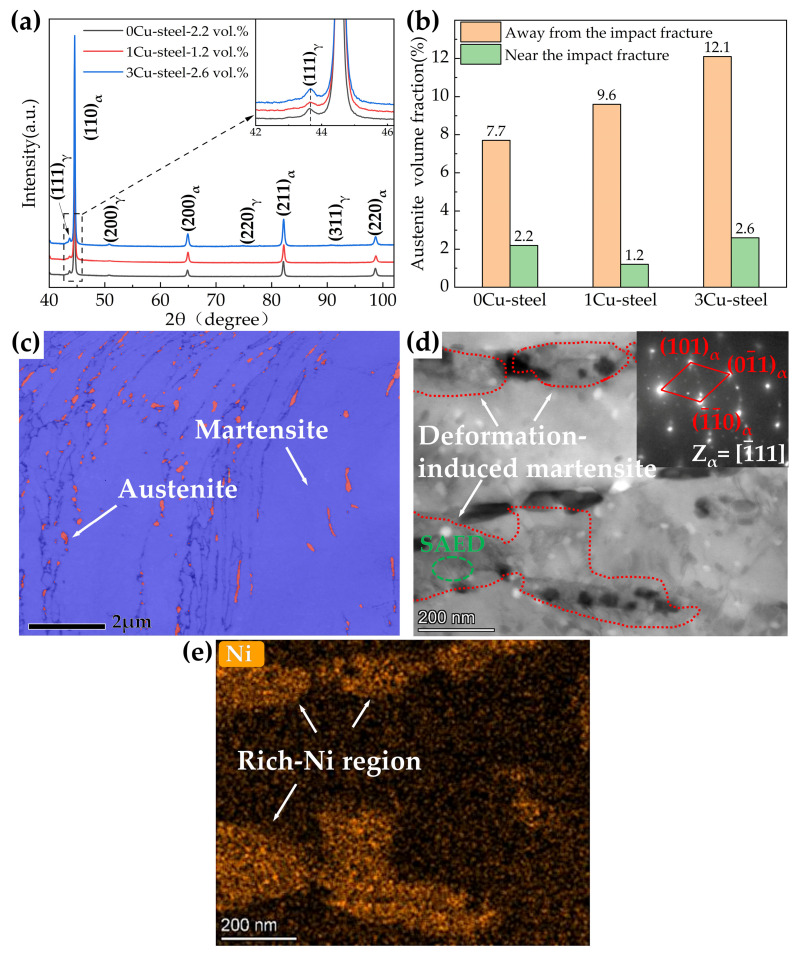
Figure 13.
(a) XRD patterns of the three steels with different Cu content tempered at 600 °C near the impact fracture. (b) Volume fractions of reversed austenite near and away from the fracture. (c) The TKD band contrast (BC) and phase map of 3Cu-steels tempered at 600 °C near the impact fracture. (d) Bright field TEM image and the corresponding electron-diffraction analysis from the selected area of 3Cu-steels tempered at 600 °C. (e) EDS mapping of Ni for 3Cu-steels tempered at 600 °C.

