FIGURE 3.

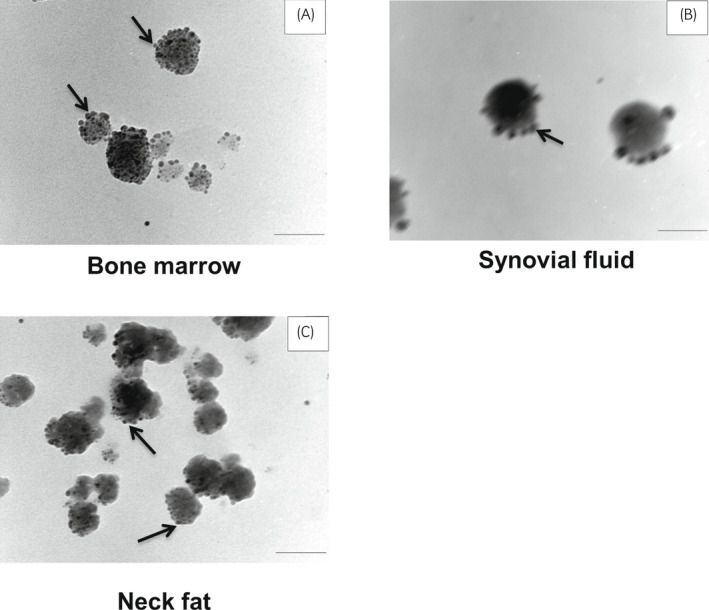
TEM images show immunogold staining with CD9. Arrows in panels A, B, and C indicate darker dots that represent the staining of marker CD9 surrounding the particles (EVs). Scale bar = 0.1 µm

TEM images show immunogold staining with CD9. Arrows in panels A, B, and C indicate darker dots that represent the staining of marker CD9 surrounding the particles (EVs). Scale bar = 0.1 µm