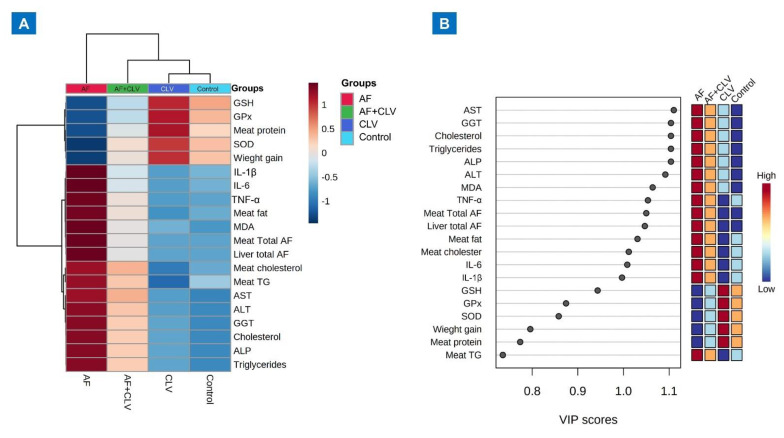
Figure 4.
Multivariate analyses of all data sets following Chlorella vulgaris and/or aflatoxin treatment. (A) Hierarchical clustering heatmap summarizes all the data via an intuitive visualization. The concentration values are represented by each colored cell on the map, with varied averages in the rows and various treatment sets in the columns. On the gradation scale, dark red is the highest value and blue is the lowest. (B) Variable importance in projection (VIP) score, the relative concentrations of the pertinent measured parameters are shown in colored boxes on the right for each study group, and a colored scale from highest (red) to lowest (blue) indicates the contribution intensity (blue).

