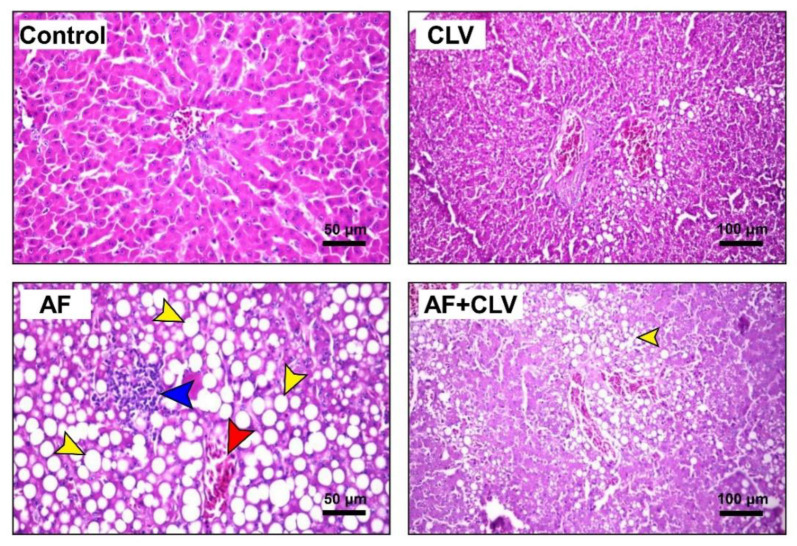
Figure 6.
Microscopic examination of liver following Chlorella vulgaris and/or aflatoxin treatment. Sections from control (bar = 50 µm) and CLV (bar = 100 µm) groups displayed normal hepatocytes and central vein. Sections from AF group showed massive diffuse fatty degeneration with circumscribed vacuolated hepatocytes (yellow arrow), together with congestion in the central vein (red arrow), and mononuclear cell infiltration (blue arrow) (bar = 50 µm). Liver of AF+CLV group showed focal fatty degeneration (bar = 100 µm). AF, aflatoxins; CLV, Chlorella vulgaris (H & E stain).

