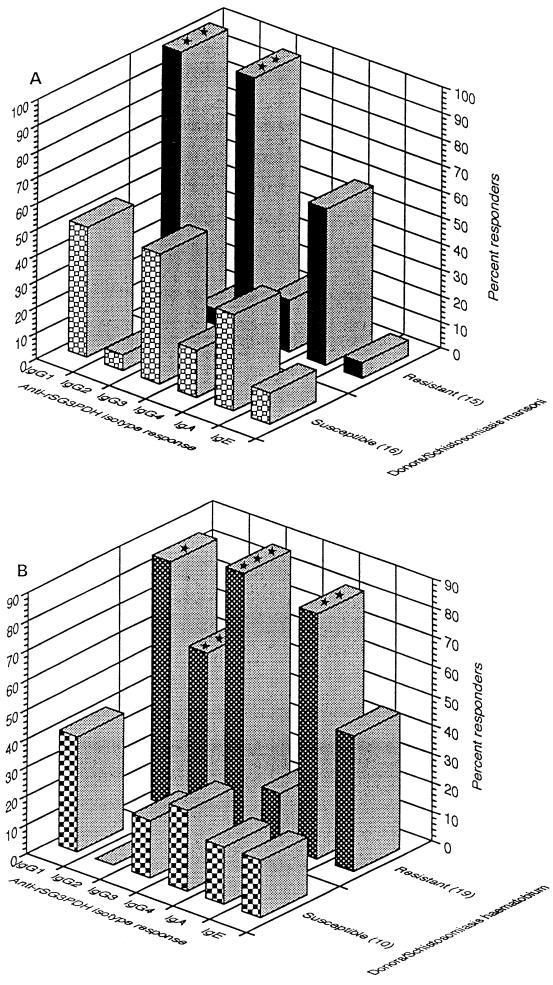
FIG. 4.
Humoral isotype response to rSG3PDH. Columns represent the percentage of susceptible and resistant individuals from the S. mansoni (A) and S. haematobium (B) groups producing antibodies to rSG3PDH as assessed by ELISA. The total number of individuals tested is shown in parentheses. Significance of differences in percent responders among resistant and susceptible donors was analyzed by Fisher's exact test. ∗, P < 0.05; ∗∗, P < 0.005; ∗∗∗, P < 0.0005.

