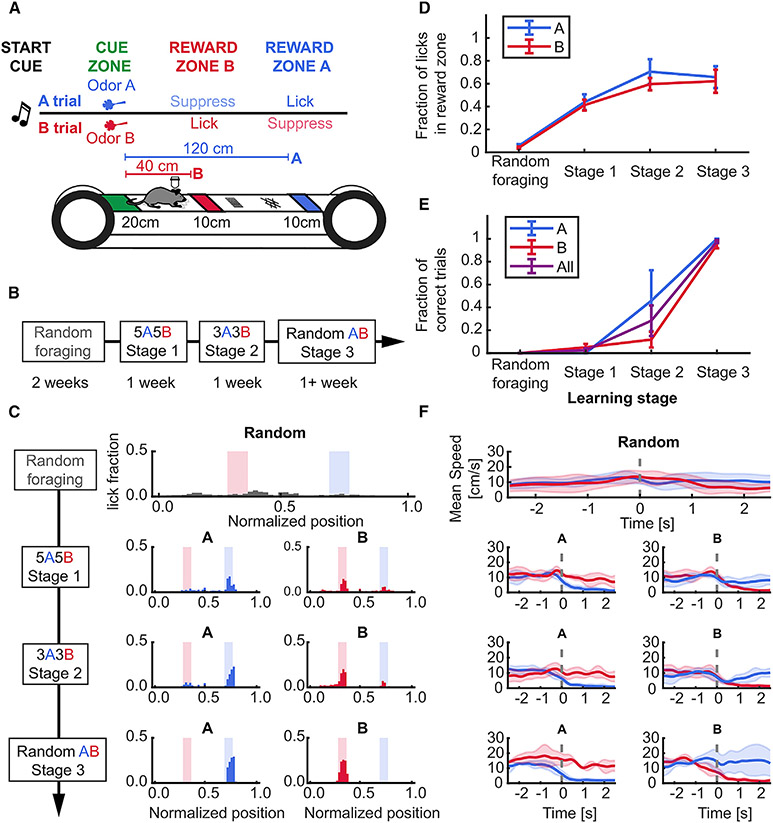
Figure 1. Stable learning of a head-fixed, odor-cued spatial navigation task.
(A) Schematic of task structure.
(B) Timeline for each stage of training: 2 weeks for randomly foraging (RF) and approximately 1 week on subsequent stages.
(C) Example lick distribution at each learning stage. Licking became progressively more specific to trial-selective reward zone with training (left, A trial laps; right, B trial laps).
(D) Lick fraction in associated reward zones increased in A and B trials during learning (RF vs. stage 3, paired t-test: A zone, 0.06 ± 0.01 vs. 0.66 ± 0.1, p = 0.031; B zone 0.04 ± 0.01 vs. 0.62 ± 0.1, p = 0.037; effect of training stage, One-way repeated measures (RM) ANOVA, A trials: p = 0.017; B trials: p = 0.008).
(E) Behavioral performance reached more than 85% in the last stage of training (RF vs. stage 3, paired t-test, A trials: 0 ± 0 vs. 1 ± 0, p = 0.04; B trials: 0 vs. 0.95 ± 0.03, p < 0.001; effect of training stage, one-way RM ANOVA, A trials: p < 0.001; B trials: p = 0.002).
(F) Example speed within ±2 seconds of entering the reward zones across training stages. At the final training stage (random AB), the animal stops upon entry into a trial-associated reward zone, running through non-rewarded zones. Dotted gray line shows onset time of reward zone entry. Data presented as mean ± standard error of the mean (error shades), n = 4 mice. See also Figure S1 and Table S1.

