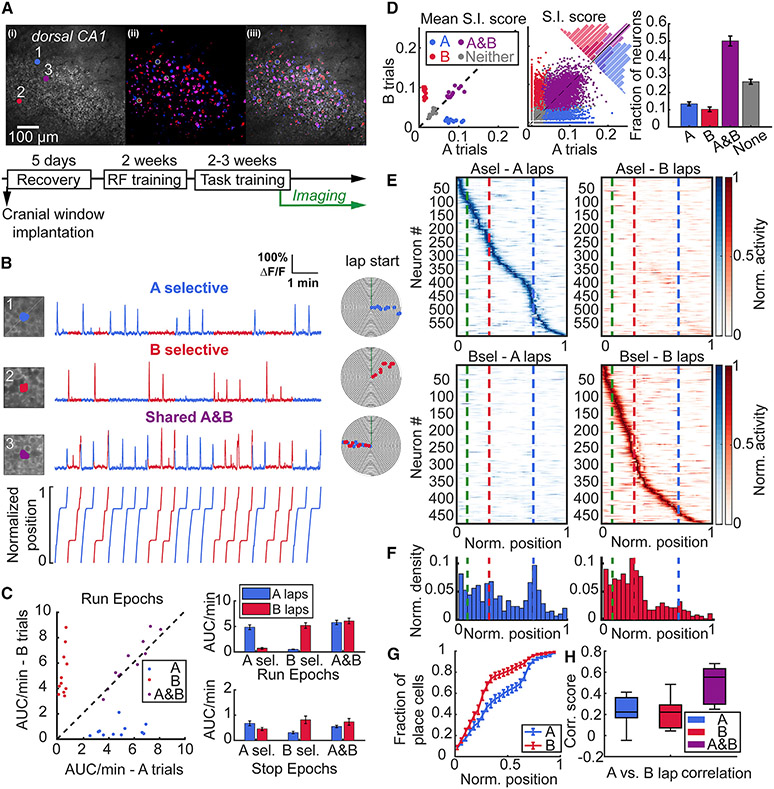
Figure 2. Task-selective place cells in dorsal CA1 during stable performance.
(A) (Top) Example field of view (FOV) of the CA1 pyramidal cell layer showing (1) the mean and (2) maximum intensity projection run-epoch imaging stacks and (3) overlay with neurons pseudocolored for trial selectivity in odor A (blue), and odor B (red) trials, while shared A and B are in magenta. (Bottom) Training timeline of mice, as in Figure 1B.
(B) Examples of A- (1) and B- (2) task selective and A and B shared (3) place cells. Numbers correspond with circled neurons in the FOV in A. Individual points on event spiral maps represent significant running-related Ca2+ events on A (blue) or B (red) trials.
(C) (Left) Calcium activity rate (area under curve per minute) of A-, B-, and A and B shared place cells plotted by each trial type during run epochs. Each point represents the mean from all neurons for 11 FOVs from 10 mice. (Right) Activity of task-selective neurons is greater on their respective task laps during run epochs (A-selective: 4.84 ± 0.47 vs. 0.7 ± 0.16, p = 0.003; B-selective: 0.51 ± 0.07 vs. 5.18 ± 0.55, **p = 0.003; shared: 5.77 ± 0.44 vs. 6.08 ± 0.56, p = 0.21), while no difference is observed during stop epochs (A-selective: 0.68 ± 0.1 vs. 0.46 ± 0.06, p = 0.082; B-selective 0.31 ± 0.05 vs. 0.82 ± 0.15, p = 0.009; shared: 0.55 ± 0.05 vs. 0.74 ± 0.13, p = 0.175). Similarly, the difference in transient rates is statistically significant between trials for A and B selective place cells during run epochs (A-selective: p = 0.003; B-selective, p = 0.003, data not shown). All comparisons were made by Wilcoxon signed-rank test and data reported as mean ± standard error of the mean.
(D) S.I. scores (bits/Ca2+ event) for each neuron type on A and B laps during each session plotted as (Left) mean of each animal, and (Center) pooled distribution of all 5158 imaged neurons. (Right) Fraction of place cells tuned according to S.I. (S.I. fraction: Friedman test, p < 0.001) showing highest number of A and B shared cells (A vs. A and B: 0.13 ± 0.01 vs. 0.5 ± 0.03, p = 0.003; B vs. A and B: 0.1 ± 0.01 vs. 0.5 ± 0.03, p = 0.003) and more A-than B-selective neurons (Fraction of A vs. B: 0.13 ± 0.01 vs. 0.1 ± 0.01, p = 0.014). Wilcoxon signed-rank test was used for comparisons.
(E) Rate maps from all mice for A- and B-task selective place cells on A and B laps. Each neuron’s rate is normalized to its maximum rate across both trial types and sorted according to the position of their maximum rate across 100 spatial bins on each lap type. Dashed lines indicate the end of odor zone in green, start of B reward zone in red, and start of A reward zone in blue.
(F) Distribution of place field centroids for A- and B-selective place cells across the track (25 spatial bins). Both categories of place cells are non-uniformly distributed across the track, with a skew toward the initial segment (zone I) of the track (place field distribution, A-selective: p = 0.009; B-selective: p < 0.001, Rayleigh test of uniformity). A-selective place cells also show aggregation at more distant locations on the track near the A reward zone.
(G) Distribution of place field centroids differs between A-selective and B-selective place cells (2-sample Kolmogorov-Smirnov test, p < 0.001).
(H) Pearson correlation of spatial TCs between A and B laps for A-, B-, and shared A and B place cells. Spatial correlation scores are low for task selective neurons with no difference between groups and significantly lower compared with task shared neurons consistent with effective discrimination between each category of place cells (A-selective: 0.24 ± 0.04; B-selective: 0.21 ± 0.04; A and B 0.49 ± 0.05; A- vs. A and B: p = 0.003; B- vs. A and B: p = 0.003, Wilcoxon signed-rank test). Central mark indicates median and top and bottom boxes indicate 25th and 75th percentiles, respectively. Whiskers denote the most extreme data points. Data shown from 11 FOV from n = 10 mice. See also Figure S2 and Table S2.

