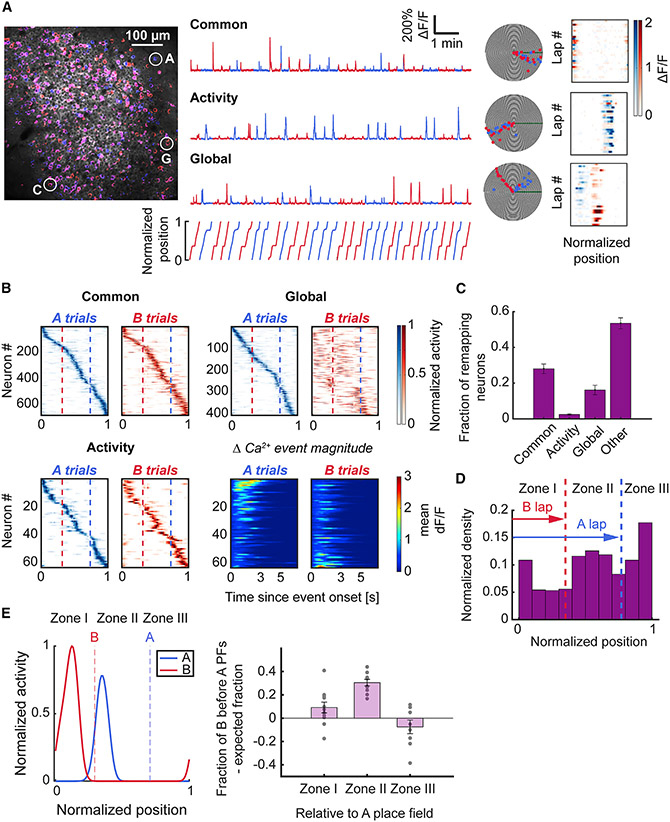
Figure 3. Place cells show distinct and task-oriented for ms of re-mapping between trial types.
(A) (Left) Imaging field overlaid with maximum intensity projection on A-laps (blue) and B-laps (red). (Right) Example ΔF/F traces and polar plots of different types of place cells. (Top) Common neuron that fires in its place field regardless of trial type. (Middle) Activity re-mapping neuron with place field calcium activity modulated by trial type. (Bottom) Global re-mapping neuron which has distinct place fields on each trial type. Colormaps (blue for A-trials, red for B-trials) on the right show the mean ΔF/F activity in each spatial bin on each trial. Note the difference in the ΔF/F signal intensity of the activity re-mapping neuron between A and B laps.
(B) Spatial tuning colormaps for each class of place cells. Cells are sorted according to the spatial bin of maximum rate on A laps. Note the predominant shift of global re-mapping neurons’ place fields toward earlier locations on the track on B laps. Bottom right panels depict the mean ΔF/F value relative to the onset of the Ca2+ event in the place field for activity re-mapping neurons. The activity map was sorted according to the difference between the peak mean ΔF/F value of Ca2+ transients in the place field on A vs. B trials.
(C) The difference in proportions was significant between the common class and activity and global re-mapping classes of place cells (Friedman test, p < 0.001; common vs. activity: 0.28 ± 0.03 vs. 0.02 ± 0, p = 0.002; common vs. global: 0.28 ± 0.03 vs. 0.16 ± 0.03, p = 0.032; Wilcoxon signed-rank test). The distribution of place cell categories was compared relative to normalized counts of all categories for each animal. Bars indicate mean ± standard error of the mean.
(D) Common place cells were distributed across the track according to spatial task demand. The place field density was lowest in zone I (before the B reward zone); the density increased across track length, in contrast with task-selective place maps, which show greater density at track start (Figure 2F) (Rayleigh test of uniformity, p < 0.001).
(E) Global re-mapping neurons exhibited task-oriented re-mapping of place fields. (Left) Example of a global re-mapping neuron with a place field centroid in zone II on A laps and a place field centroid in zone I on B laps. Right, quantification of the fraction of global re-mapping neurons with B fields before A fields in each zone, compared with the expected fraction (see STAR Methods). Place cells with place field centroids located in zone II (between the reward zones) on A laps exhibited a statistically significant shift of place fields on B trials to earlier positions on the track (zone II A vs. B lap field shift: 0.3 ± 0.03, one-sample Wilcoxon signed-rank test against 0, p < 0.001); 11 fields of view from n = 10 mice. See also Figure S3 and Table S3.

