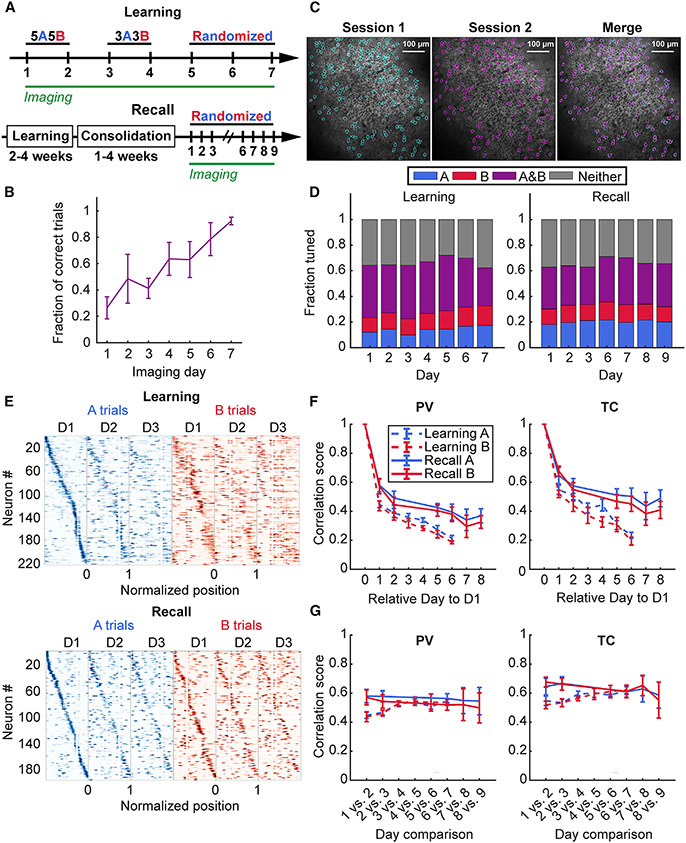
Figure 4. Learning induces rapid re-mapping of place maps.
(A) Schematic of the accelerated training regimen and imaging schedule for odor-cued spatial navigation (see STAR Methods). (Bottom) Timeline for memory recall imaging experiments following learning.
(B) Learning performance during accelerated learning. Mice achieve high behavior performance by the last day of training (mean ± standard error of the mean 92 ± 2%, n = 6 mice).
(C) Example of matching spatial components (regions of interest) across two different sessions.
(D) Task-dependent tuning of place cells occurs as early as the first day of training and persists during learning with increase in fraction of A-trial tuned place cells during A, but not B trials (A trials: one-way repeated measures [RM] mixed effects analysis, effect of training day, p < 0.001; B trials: one-way RM mixed effects analysis, effect of training day, p = 0.27) with no change during recall (A trials: one-way RM mixed effects analysis, effect of training day, p = 0.92; B trials: one-way RM mixed effects analysis, effect of training day, p = 0.95). Data from n = 6 mice in learning and n = 5 mice in the recall cohort.
(E) Example spatial tuning maps that show rapid re-mapping of spatial activity during learning (top) in contrast to memory recall following learning (bottom).
(F) (Left) PV correlation of all matching cells relative to Day 1 of imaging shows rapid restructuring of run-related activity on the following training day that stabilizes on recall trials (A trials: two-way RM mixed effects analysis, effect of time, p < 0.001, effect of behavior, p = 0.015, interaction, p = 0.519; B trials: two-way RM mixed effects analysis, effect of time, p < 0.001, effect of behavior, p = 0.014, interaction, p = 0.18; day 2 vs. day 7, recall, A trials: 0.58 ± 0.05 vs. 0.39 ± 0.06, p = 0.003; B trials: 0.57 ± 0.05 vs. 0.38 ± 0.05, p = 0.002, n = 5 mice), but not during learning (day 2 vs. day 7, learning, A trials: 0.43± 0.03 vs. 0.19± 0.01; p = 0.028; B trials: 0.41 ± 0.04 vs. 0.19 ± 0.01, p = 0.053, n = 3 mice; day 7, learning vs. recall, A trials: 0.21 ± 0.02 vs. 0.39 ± 0.06, unpaired t-test, p = 0.027; B trials: 0.19 ± 0.01 vs. 0.38 ± 0.05, unpaired t-test, p = 0.014,n = 4 mice in learning and n = 5 mice in recall cohort). (Right) A similar trend was observed for the TC correlation scores between matching place cells selected using the T.S. criterion (A trials: two-way RM mixed effects analysis, effect of time, p < 0.001, effect of behavior, p = 0.017, interaction, p = 0.021; B trials: two-way RM mixed effects analysis, effect of time, p < 0.001, effect of behavior, p = 0.008, interaction, p = 0.189; day 2 vs. day 7, learning, A trials: 0.51 ± 0.03 vs. 0.22 ± 0.02, p = 0.028; B trials: 0.51 ± 0.03 vs. 0.19 ± 0.04, p = 0.045, n = 3 mice; day 2 vs. day 7 recall, A trials: 0.65 ± 0.06 vs. 0.5 ± 0.06, p = 0.014; B trials: 0.68 ± 0.03 vs. 0.45 ± 0.05, p = 0.006, n = 5 mice; day 7, learning vs. recall, A trials: 0.23 ± 0.02 vs. 0.5 ± 0.06, unpaired t-test, p = 0.009; B trials: 0.19 ± 0.03 vs. 0.45 ± 0.05, p = 0.01, n = 4 mice in learning and 5 mice in recall cohort). Paired t-test used for all statistics unless otherwise noted. Data from n = 6 mice in the learning and n = 5 mice in the recall cohort.
(G) Learning stabilizes neighboring session maps at the population level and between place cells. As learning progresses through each training stage, the population correlation scores approach those observed for the memory-consolidated recall cohort (A trials: two-way RM mixed effects analysis, effect of time, p = 0.042, effect of behavior, p = 0.044, interaction, p = 0.006; B trials: two-way RM mixed effects analysis, effect of time, p = 0.4; effect of behavior, p = 0.204, interaction, p = 0.012; day 1 vs. day 2 vs. day 6 vs. day 7, learning, A trials: 0.43 ± 0.03 vs. 0.54 ± 0.01, p = 0.034; B trials: 0.41 ± 0.04 vs. 0.52 ± 0.01, p = 0.136, n = 3 mice; day 1 vs. day 2 vs. day 6 vs. day 7, recall, A trials: 0.58 ± 0.05 vs. 0.56 ± 0.03, p = 0.611; B trials: 0.57 ± 0.05 vs. 0.52 ± 0.04, p = 0.20, n = 5 mice). For spatially tuned neurons, the stabilization occurred during learning on both A and B trials, but not during recall (A trials: two-way RM mixed effects analysis, effect of time, p = 0.492, effect of behavior, p = 0.16, interaction, p = 0.013; B trials: two-way RM mixed effects analysis, effect of time, p = 0.59, effect of behavior, p = 0.064, interaction, p = 0.003; day 1 vs. day 2 vs. day 6 vs. day 7, learning, A trials: 0.51 ± 0.03 vs. 0.61 ± 0.03, p = 0.028; B trials: 0.51 ± 0.03 vs. 0.6 ± 0.01, p = 0.036, n = 3 mice; day 1 vs. day 2 vs. day 6 vs. day 7, recall, A trials: 0.65 ± 0.06 vs. 0.61 ± 0.04, p = 0.47; B trials: 0.68 ± 0.03 vs. 0.61 ± 0.04, p = 0.162, n = 5 mice). Paired t-test used for all statistics unless otherwise noted. Data from n = 6 mice in the learning and n = 5 mice in the recall cohort. See also Figures S4 and S5 and Tables S4 and S5.

