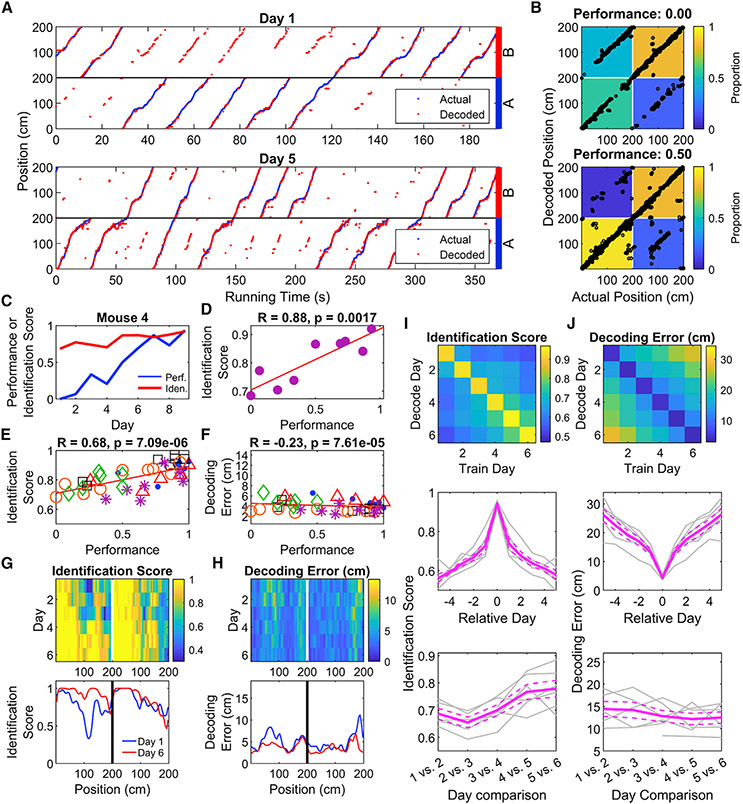
Figure 6. Place maps incorporate information about and predict location and trial type during task learning.
(A) A PV decoder accurately predicts the position of an animal during both the initial (top) and late (bottom) training sessions. Decoded mouse positions (red) are plotted against the actual positions (blue) as a function of time. On the late training session, the decoder for this animal identifies the trial the animal is on with high accuracy. Throughout the figure, positions 0–200 are represented twice, once each for A and B trials. Data from this mouse only are used in B–D.
(B) Confusion matrices quantifying decoding accuracy demonstrate improved accuracy in identifying trial type associated with improved performance. Black points represent the actual position and trial of the animal plotted against the decoder’s prediction. Each matrix cell represents the number of decoded points falling into each quadrant divided by the total data points in each trial type.
(C) Example plot showing that as the performance of a single mouse increases with subsequent training sessions, the identification score (proportion of data points correctly classified as trial type A or B) also increases.
(D) Same data as in (C) with performance plotted against decoding score, revealing a strong positive relationship between task performance and decoder score (two-sided one-sample t-test, p = 0.002).
(E) Cumulative analysis across all training sessions revealed a strong positive relationship between performance and identification score (two-way ANOVA, R = 0.68; effect of mouse, p = 0.34; effect of performance, p = 7.1 × 10⁻⁶; interaction, p = 0.55). Each point is a single training session and each mark type a different animal.
(F) Position decoding error and task performance shows only a weak relationship (two-way ANOVA, R = −0.23; effect of mouse, p = 1.5 × 10⁻⁵; effect of performance, p = 7.6 × 10⁻⁵; interaction, p = 0.03).
(G) Colormap showing improvement in the position-trial decoding accuracy as function of training session. Each row denotes the median decoding score (n = 6 animals). The decoding score increases progressively forward along the track during each training session, prominently observed on A trials. Bottom graph plots decoding score for sessions 1 and 6.
(H) Similar plot of the decoding position error averaged across all animals does not reveal such change during training.
(I) Top, Image depicting the identification score of classifiers trained on one day and tested on another (see STAR Methods). Middle, mean value of successive diagonals of the above image, showing the drop in identification score with experience. Bottom, identification score on adjacent days shows an increase with experience, indicating a stabilization of the neural representation of trial type (two-way ANOVA, effect of mouse, p = 0.14; effect of Day, p = 0.0001; interaction, p = 0.16).
(J) As in I, but for decoding error. Adjacent-day decoding error does not significantly change with experience (two-way ANOVA, effect of mouse, p = 0.02; effect of Day, p = 0.41; interaction, p = 0.07). See also Figures S6 and S7 and Table S7.
Data presented as mean ± standard error of the mean (gray lines), n = 6 mice.

