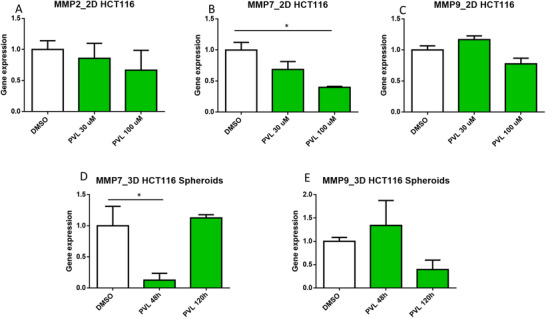
Figure 5.

Transcriptional profiling of MMP2 A), MMP7 B), and MMP9 C) target genes in 2D HCT116 cells treated with DMSO 0.05% and 5‐(3′,4′‐dihydroxyphenyl)‐γ‐valerolactone at 30 and 100 µM. After 72 h treatment, RNA was extracted to perform a qPCR. Gene expression was normalized to the reference gene RPLP0 and compared to the DMSO control. The transcriptional profiling of MMP7 D) and MMP9 E) target genes were evaluated at two different time points (48 and 120 h) on 3D HCT116 EGFP spheroids treated with DMSO 0.05% and 5‐(3′,4′‐dihydroxyphenyl)‐γ‐valerolactone (50 µM). Gene expression was normalized to the reference gene RPLP0 and compared to the DMSO control. Data are the mean ± SEM from at least three independent experiments. One‐way ANOVA followed by Holm–Sidak test (* Adjusted p < 0.05).
