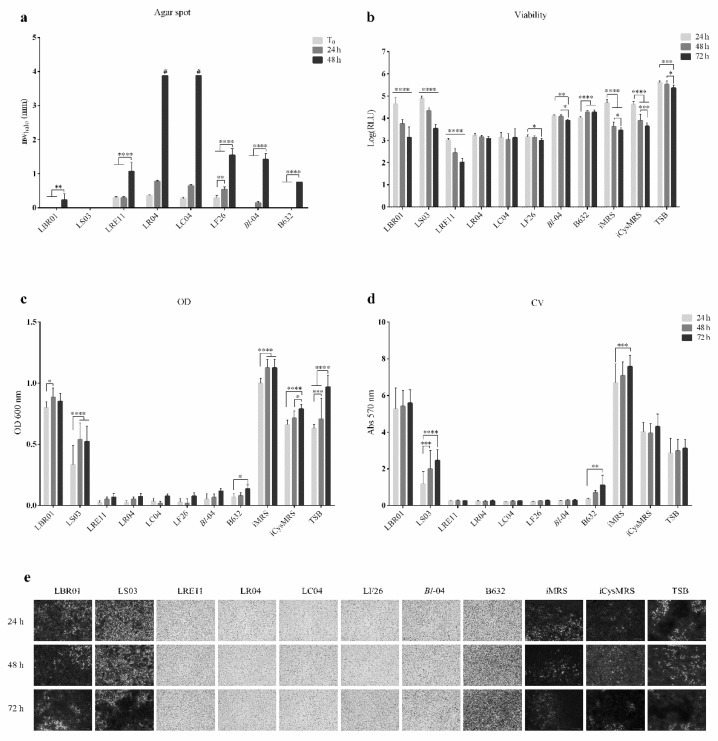
Figure 5.
Live probiotic and CFS efficacy on a complex bacterial environment. (a) Normalized width measurements of inhibition halos obtained in the complex agar spot test. The diameters in mm of the inhibition halos were measured after 48 h of the three-pathogen incubation with the probiotic spots without (T0), or with 24 and 48 h pre-incubation. In the graph, the normalized width halo (nwhalo) is expressed as the mean of three independent experiments ± SD. # complete growth inhibition zones. ** p < 0.01; **** p < 0.0001. (b) Viability assay. The pathogen-mix viability was determined after 24, 48, and 72 h of probiotic CFS treatment. Data are represented as the Log(mean) of three independent experiments ± SD. * p < 0.05; ** p < 0.01; *** p < 0.001; **** p < 0.0001. Log(RLU) = Logarithm10(relative luminescence unit); CFS = cell-free supernatant. (c) Optical density (OD) measurement at 600 nm and (d) Crystal violet (CV) biofilm quantification after CFS treatment of the complex pathogen environment. Data are represented as the mean of three independent experiments ± SD. * p < 0.05; ** p < 0.01; *** p < 0.001; **** p < 0.0001. OD 600 nm = optical density at 600 nm; Abs 570 nm = absorbance at 570 nm. (e) Representative CV-stained biofilm images obtained at FLoidTM Cell Imaging Station with magnification 460×.

