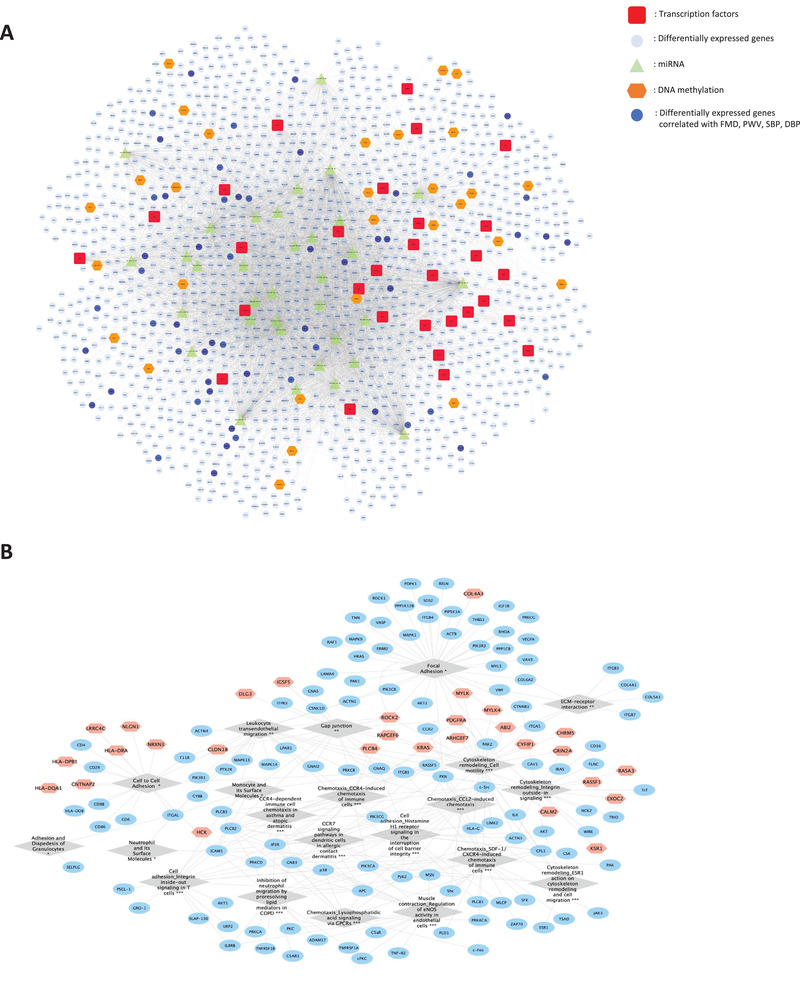
Figure 7.

Integration of the multi‐omic data. A) Integrated analyses of differentially expressed genes (blue), genes presentencing changes in DNA methylation (brown), potential transcription factors (red), and potential microRNAs (green). B) Network of genes (blue) presenting changes in expression and DNA methylation (brown) involved in pathways (grey diamond chapped) related to cell adhesion, chemotaxis, and cell mobility.
